Zip Codes with the Highest Percentage of Households with Income Above $200,000 in Warrenton, VA
RELATED REPORTS & OPTIONS
Household Income | $200k+
Warrenton
Compare Zip Codes
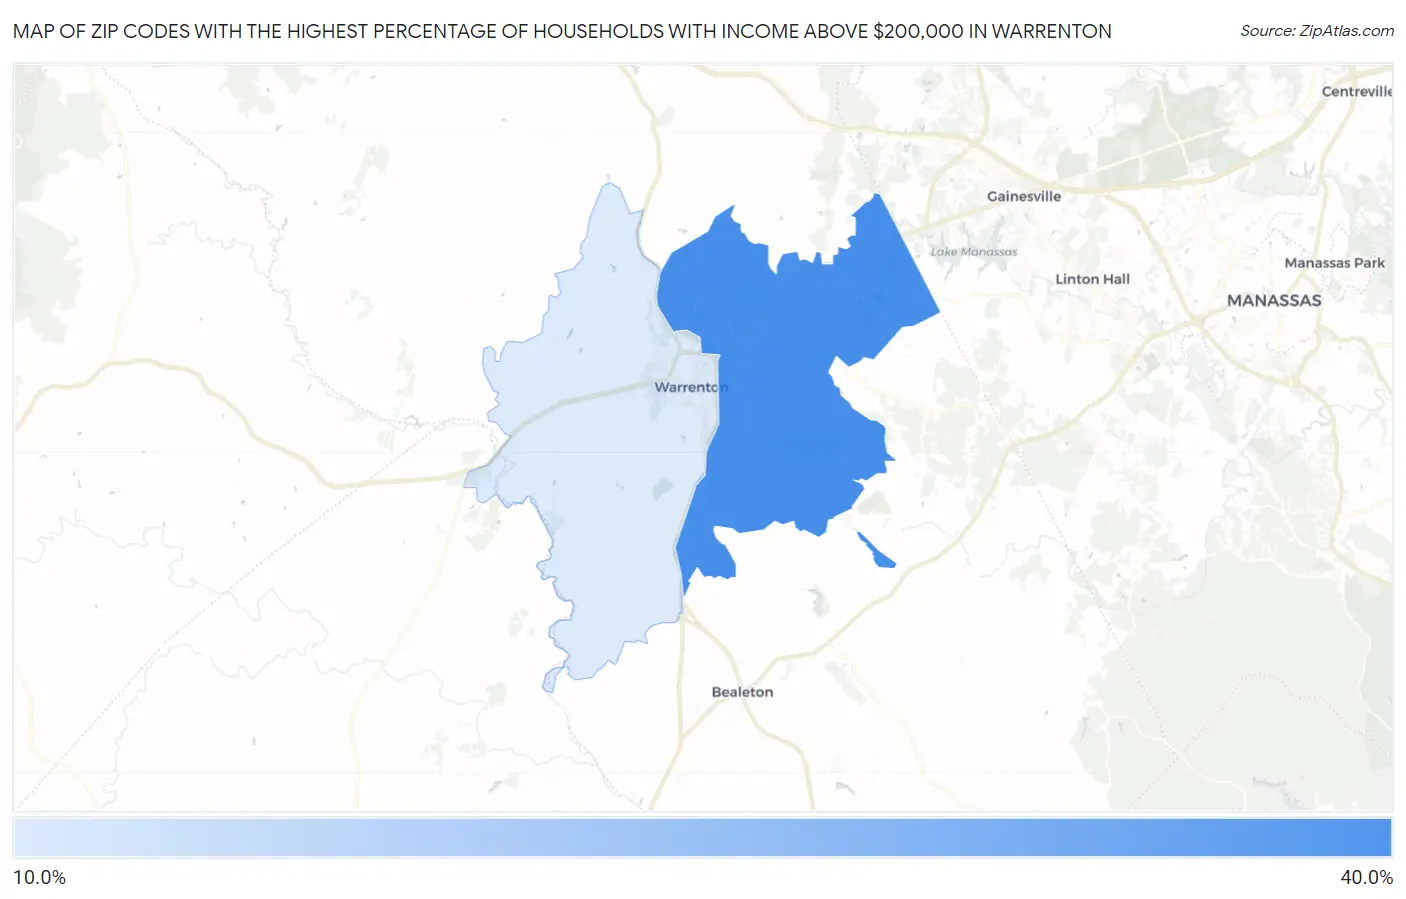
Map of Zip Codes with the Highest Percentage of Households with Income Above $200,000 in Warrenton
17.6%
33.8%
Zip Codes with the Highest Percentage of Households with Income Above $200,000 in Warrenton, VA
| Zip Code | Households with Income > $200k | vs State | vs National | |
| 1. | 20187 | 33.8% | 15.6%(+18.2)#62 | 11.4%(+22.4)#1,079 |
| 2. | 20186 | 17.6% | 15.6%(+2.00)#169 | 11.4%(+6.20)#3,973 |
1
Common Questions
What are the Top Zip Codes with the Highest Percentage of Households with Income Above $200,000 in Warrenton, VA?
Top Zip Codes with the Highest Percentage of Households with Income Above $200,000 in Warrenton, VA are:
What zip code has the Highest Percentage of Households with Income Above $200,000 in Warrenton, VA?
20187 has the Highest Percentage of Households with Income Above $200,000 in Warrenton, VA with 33.8%.
What is the Percentage of Households with Income Above $200,000 in Warrenton, VA?
Percentage of Households with Income Above $200,000 in Warrenton is 11.0%.
What is the Percentage of Households with Income Above $200,000 in Virginia?
Percentage of Households with Income Above $200,000 in Virginia is 15.6%.
What is the Percentage of Households with Income Above $200,000 in the United States?
Percentage of Households with Income Above $200,000 in the United States is 11.4%.