Zip Codes with the Highest Percentage of Population Taking Taxi / Cab to Work in Abingdon, VA
RELATED REPORTS & OPTIONS
Taxi / Cab
Abingdon
Compare Zip Codes
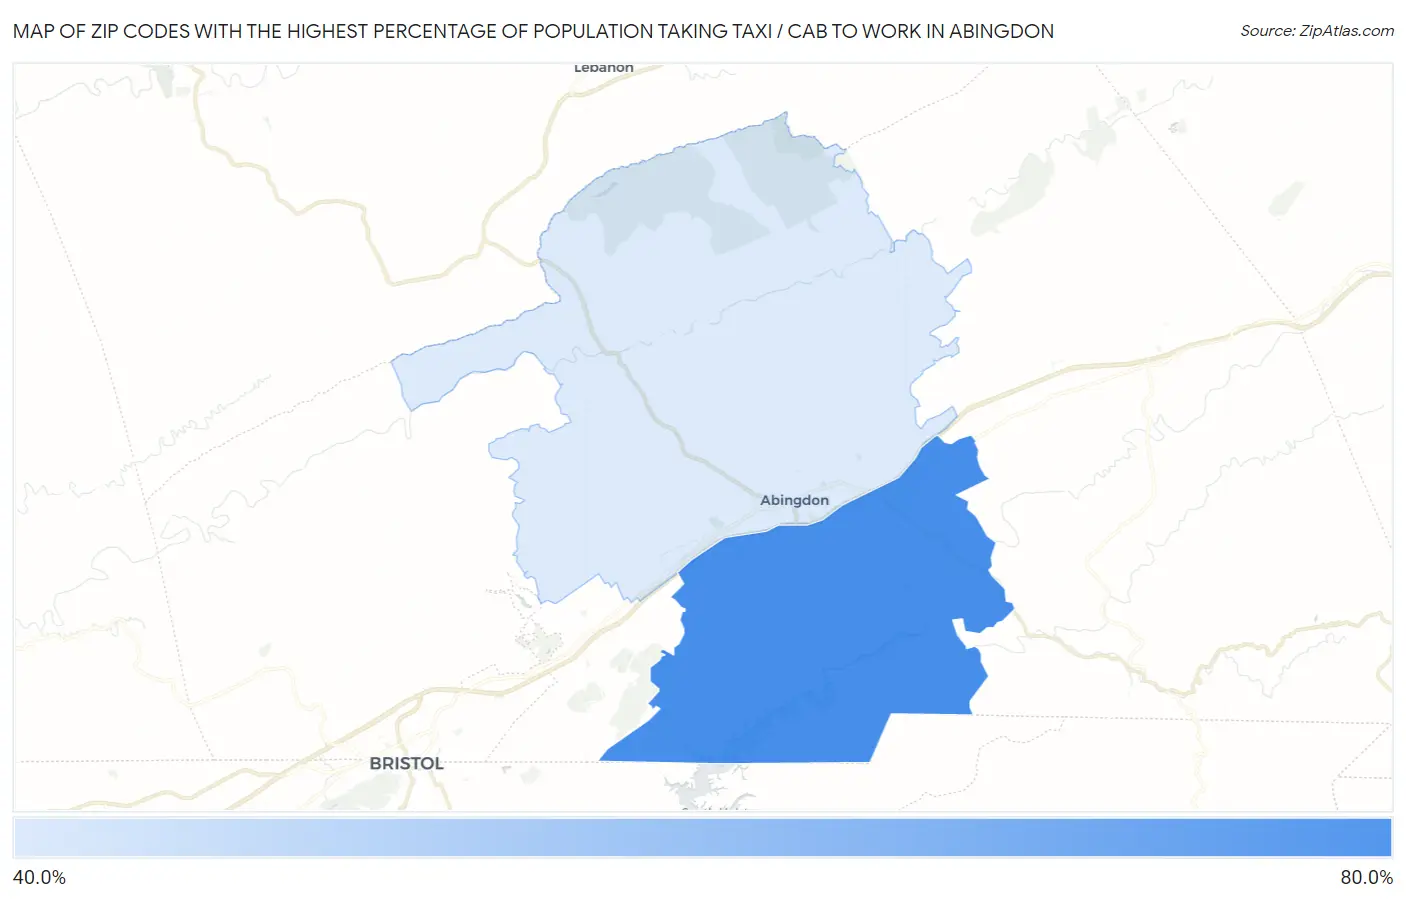
Map of Zip Codes with the Highest Percentage of Population Taking Taxi / Cab to Work in Abingdon
44.7%
61.2%
Zip Codes with the Highest Percentage of Population Taking Taxi / Cab to Work in Abingdon, VA
| Zip Code | % Take Taxi / Cab | vs State | vs National | |
| 1. | 24211 | 61.2% | 39.4%(+21.8)#12 | 38.2%(+23.0)#513 |
| 2. | 24210 | 44.7% | 39.4%(+5.30)#106 | 38.2%(+6.50)#4,758 |
1
Common Questions
What are the Top Zip Codes with the Highest Percentage of Population Taking Taxi / Cab to Work in Abingdon, VA?
Top Zip Codes with the Highest Percentage of Population Taking Taxi / Cab to Work in Abingdon, VA are:
What zip code has the Highest Percentage of Population Taking Taxi / Cab to Work in Abingdon, VA?
24211 has the Highest Percentage of Population Taking Taxi / Cab to Work in Abingdon, VA with 61.2%.
What is the Percentage of Population Taking Taxi / Cab to Work in Abingdon, VA?
Percentage of Population Taking Taxi / Cab to Work in Abingdon is 44.2%.
What is the Percentage of Population Taking Taxi / Cab to Work in Virginia?
Percentage of Population Taking Taxi / Cab to Work in Virginia is 39.4%.
What is the Percentage of Population Taking Taxi / Cab to Work in the United States?
Percentage of Population Taking Taxi / Cab to Work in the United States is 38.2%.