Zip Codes with the Highest Percentage of Population Employed in Accommodation & Food Services in Abingdon, VA
RELATED REPORTS & OPTIONS
Accommodation & Food Services
Abingdon
Compare Zip Codes
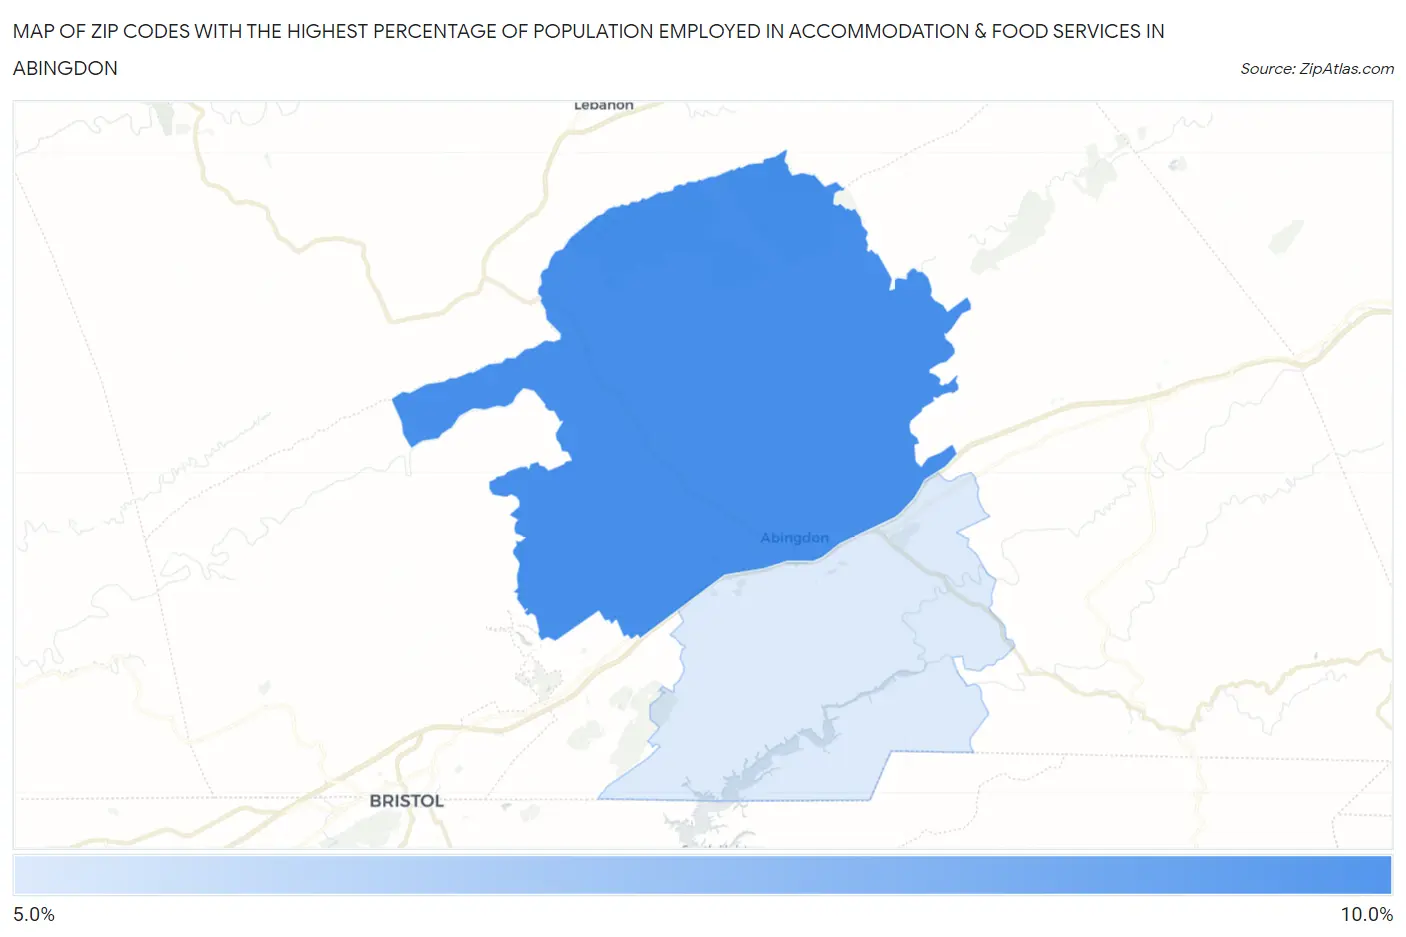
Map of Zip Codes with the Highest Percentage of Population Employed in Accommodation & Food Services in Abingdon
5.9%
9.1%
Zip Codes with the Highest Percentage of Population Employed in Accommodation & Food Services in Abingdon, VA
| Zip Code | % Employed | vs State | vs National | |
| 1. | 24210 | 9.1% | 6.4%(+2.63)#148 | 6.9%(+2.19)#5,858 |
| 2. | 24211 | 5.9% | 6.4%(-0.556)#367 | 6.9%(-0.996)#13,816 |
1
Common Questions
What are the Top Zip Codes with the Highest Percentage of Population Employed in Accommodation & Food Services in Abingdon, VA?
Top Zip Codes with the Highest Percentage of Population Employed in Accommodation & Food Services in Abingdon, VA are:
What zip code has the Highest Percentage of Population Employed in Accommodation & Food Services in Abingdon, VA?
24210 has the Highest Percentage of Population Employed in Accommodation & Food Services in Abingdon, VA with 9.1%.
What is the Percentage of Population Employed in Accommodation & Food Services in Abingdon, VA?
Percentage of Population Employed in Accommodation & Food Services in Abingdon is 9.5%.
What is the Percentage of Population Employed in Accommodation & Food Services in Virginia?
Percentage of Population Employed in Accommodation & Food Services in Virginia is 6.4%.
What is the Percentage of Population Employed in Accommodation & Food Services in the United States?
Percentage of Population Employed in Accommodation & Food Services in the United States is 6.9%.