Zip Codes with the Highest Percentage of Population Employed in Food Preparation & Serving in Odessa, TX
RELATED REPORTS & OPTIONS
Food Preparation & Serving
Odessa
Compare Zip Codes
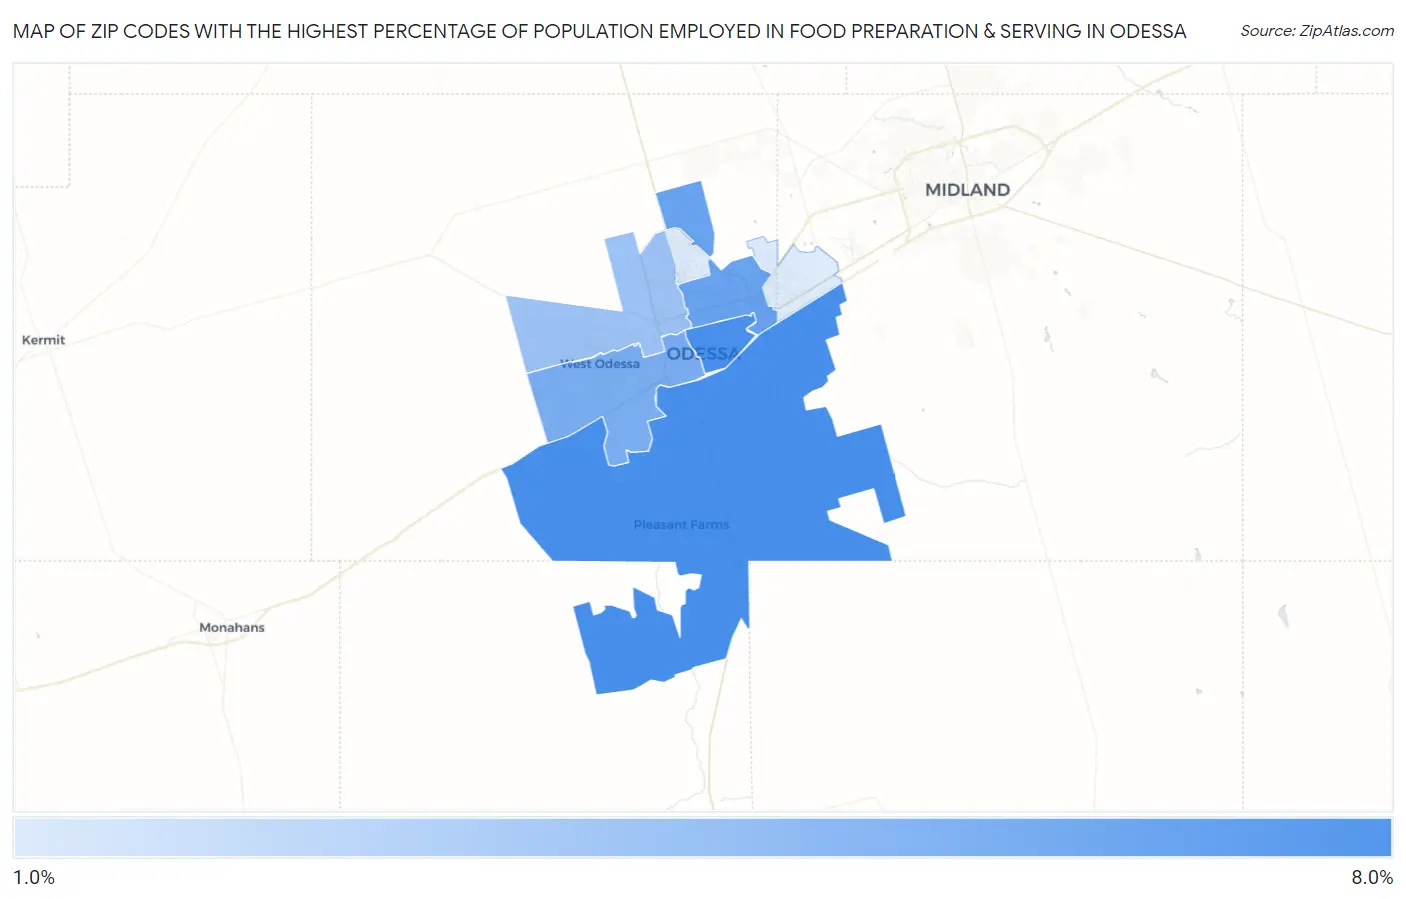
Map of Zip Codes with the Highest Percentage of Population Employed in Food Preparation & Serving in Odessa
1.6%
7.0%
Zip Codes with the Highest Percentage of Population Employed in Food Preparation & Serving in Odessa, TX
| Zip Code | % Employed | vs State | vs National | |
| 1. | 79766 | 7.0% | 5.4%(+1.69)#407 | 5.3%(+1.76)#6,448 |
| 2. | 79761 | 6.9% | 5.4%(+1.59)#417 | 5.3%(+1.65)#6,720 |
| 3. | 79762 | 5.9% | 5.4%(+0.510)#592 | 5.3%(+0.575)#9,813 |
| 4. | 79763 | 5.2% | 5.4%(-0.172)#762 | 5.3%(-0.107)#12,243 |
| 5. | 79764 | 4.0% | 5.4%(-1.33)#1,040 | 5.3%(-1.26)#17,037 |
| 6. | 79765 | 1.6% | 5.4%(-3.71)#1,489 | 5.3%(-3.65)#25,687 |
1
Common Questions
What are the Top 5 Zip Codes with the Highest Percentage of Population Employed in Food Preparation & Serving in Odessa, TX?
Top 5 Zip Codes with the Highest Percentage of Population Employed in Food Preparation & Serving in Odessa, TX are:
What zip code has the Highest Percentage of Population Employed in Food Preparation & Serving in Odessa, TX?
79766 has the Highest Percentage of Population Employed in Food Preparation & Serving in Odessa, TX with 7.0%.
What is the Percentage of Population Employed in Food Preparation & Serving in Odessa, TX?
Percentage of Population Employed in Food Preparation & Serving in Odessa is 5.7%.
What is the Percentage of Population Employed in Food Preparation & Serving in Texas?
Percentage of Population Employed in Food Preparation & Serving in Texas is 5.4%.
What is the Percentage of Population Employed in Food Preparation & Serving in the United States?
Percentage of Population Employed in Food Preparation & Serving in the United States is 5.3%.