Zip Codes with the Highest Percentage of Population Employed in Food Preparation & Serving in Mission, TX
RELATED REPORTS & OPTIONS
Food Preparation & Serving
Mission
Compare Zip Codes
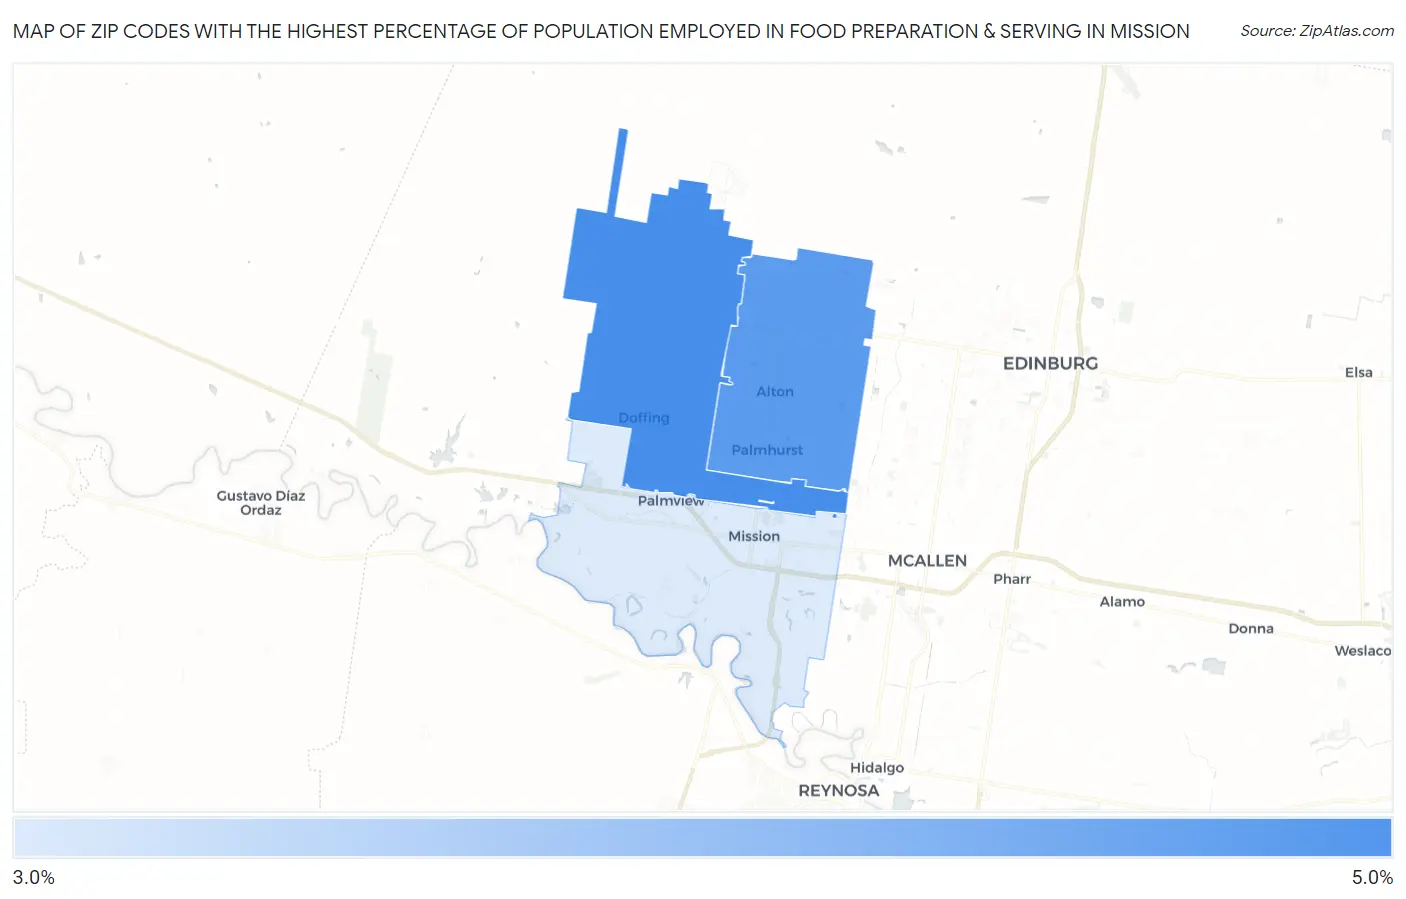
Map of Zip Codes with the Highest Percentage of Population Employed in Food Preparation & Serving in Mission
3.5%
4.9%
Zip Codes with the Highest Percentage of Population Employed in Food Preparation & Serving in Mission, TX
| Zip Code | % Employed | vs State | vs National | |
| 1. | 78574 | 4.9% | 5.4%(-0.456)#832 | 5.3%(-0.391)#13,379 |
| 2. | 78573 | 4.7% | 5.4%(-0.630)#876 | 5.3%(-0.565)#14,075 |
| 3. | 78572 | 3.5% | 5.4%(-1.83)#1,149 | 5.3%(-1.77)#19,121 |
1
Common Questions
What are the Top Zip Codes with the Highest Percentage of Population Employed in Food Preparation & Serving in Mission, TX?
Top Zip Codes with the Highest Percentage of Population Employed in Food Preparation & Serving in Mission, TX are:
What zip code has the Highest Percentage of Population Employed in Food Preparation & Serving in Mission, TX?
78574 has the Highest Percentage of Population Employed in Food Preparation & Serving in Mission, TX with 4.9%.
What is the Percentage of Population Employed in Food Preparation & Serving in Mission, TX?
Percentage of Population Employed in Food Preparation & Serving in Mission is 3.7%.
What is the Percentage of Population Employed in Food Preparation & Serving in Texas?
Percentage of Population Employed in Food Preparation & Serving in Texas is 5.4%.
What is the Percentage of Population Employed in Food Preparation & Serving in the United States?
Percentage of Population Employed in Food Preparation & Serving in the United States is 5.3%.