Zip Codes with the Highest Percentage of Population Employed in Agriculture, Fishing & Hunting in Mission, TX
RELATED REPORTS & OPTIONS
Agriculture, Fishing & Hunting
Mission
Compare Zip Codes
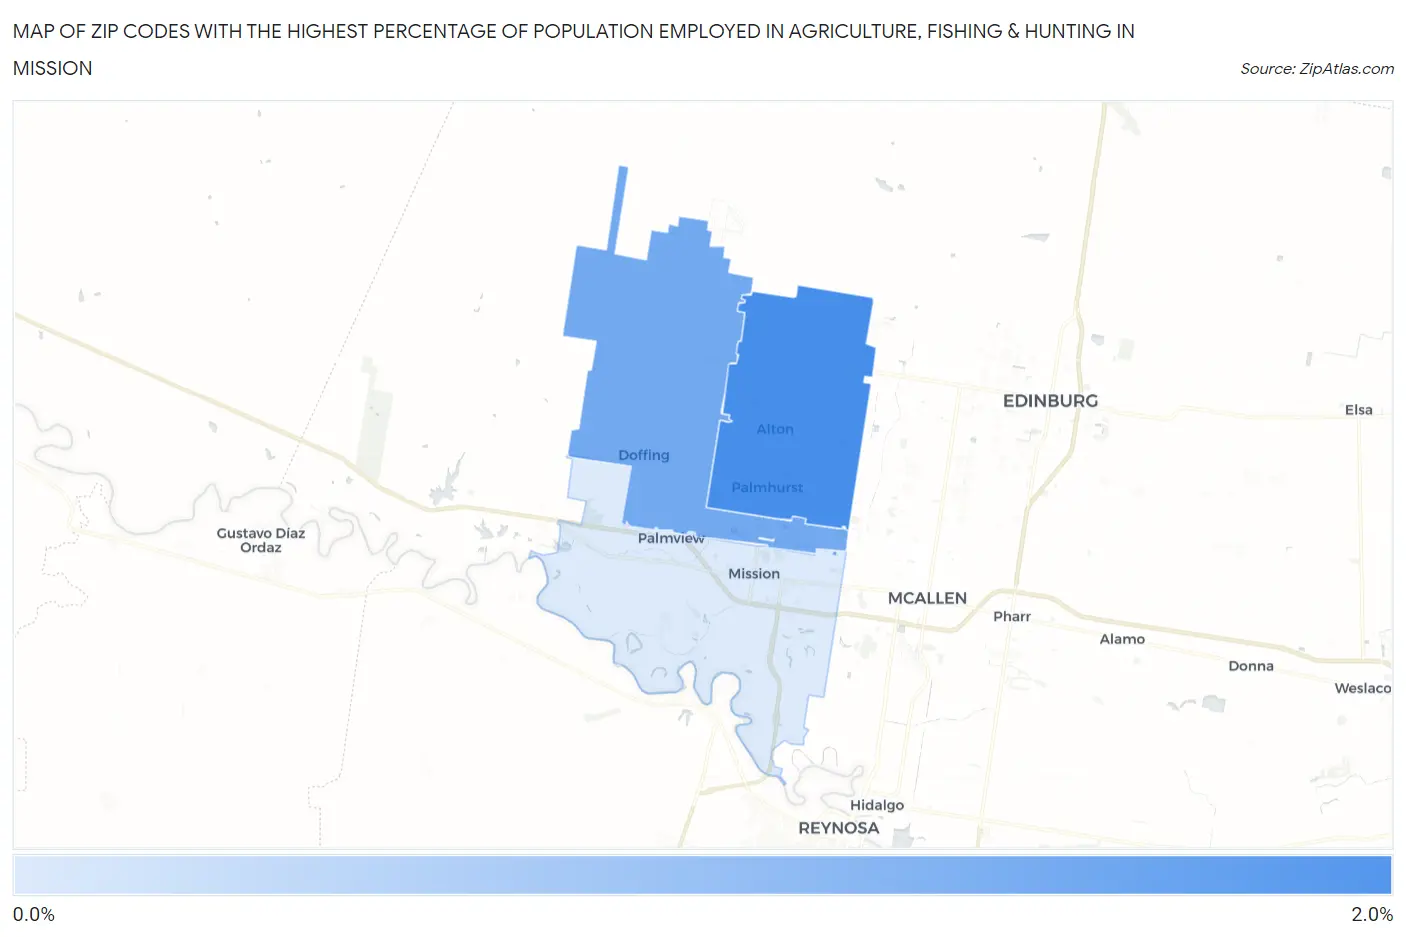
Map of Zip Codes with the Highest Percentage of Population Employed in Agriculture, Fishing & Hunting in Mission
0.39%
2.0%
Zip Codes with the Highest Percentage of Population Employed in Agriculture, Fishing & Hunting in Mission, TX
| Zip Code | % Employed | vs State | vs National | |
| 1. | 78573 | 2.0% | 0.75%(+1.20)#669 | 1.2%(+0.757)#12,879 |
| 2. | 78574 | 1.5% | 0.75%(+0.736)#754 | 1.2%(+0.288)#14,334 |
| 3. | 78572 | 0.39% | 0.75%(-0.361)#1,099 | 1.2%(-0.808)#20,236 |
1
Common Questions
What are the Top Zip Codes with the Highest Percentage of Population Employed in Agriculture, Fishing & Hunting in Mission, TX?
Top Zip Codes with the Highest Percentage of Population Employed in Agriculture, Fishing & Hunting in Mission, TX are:
What zip code has the Highest Percentage of Population Employed in Agriculture, Fishing & Hunting in Mission, TX?
78573 has the Highest Percentage of Population Employed in Agriculture, Fishing & Hunting in Mission, TX with 2.0%.
What is the Percentage of Population Employed in Agriculture, Fishing & Hunting in Mission, TX?
Percentage of Population Employed in Agriculture, Fishing & Hunting in Mission is 0.61%.
What is the Percentage of Population Employed in Agriculture, Fishing & Hunting in Texas?
Percentage of Population Employed in Agriculture, Fishing & Hunting in Texas is 0.75%.
What is the Percentage of Population Employed in Agriculture, Fishing & Hunting in the United States?
Percentage of Population Employed in Agriculture, Fishing & Hunting in the United States is 1.2%.