Zip Codes with the Highest Percentage of Households Heated by Bottled Gas / Liquid Propane in Duncanville, TX
RELATED REPORTS & OPTIONS
Bottled Gas / LP Heating
Duncanville
Compare Zip Codes
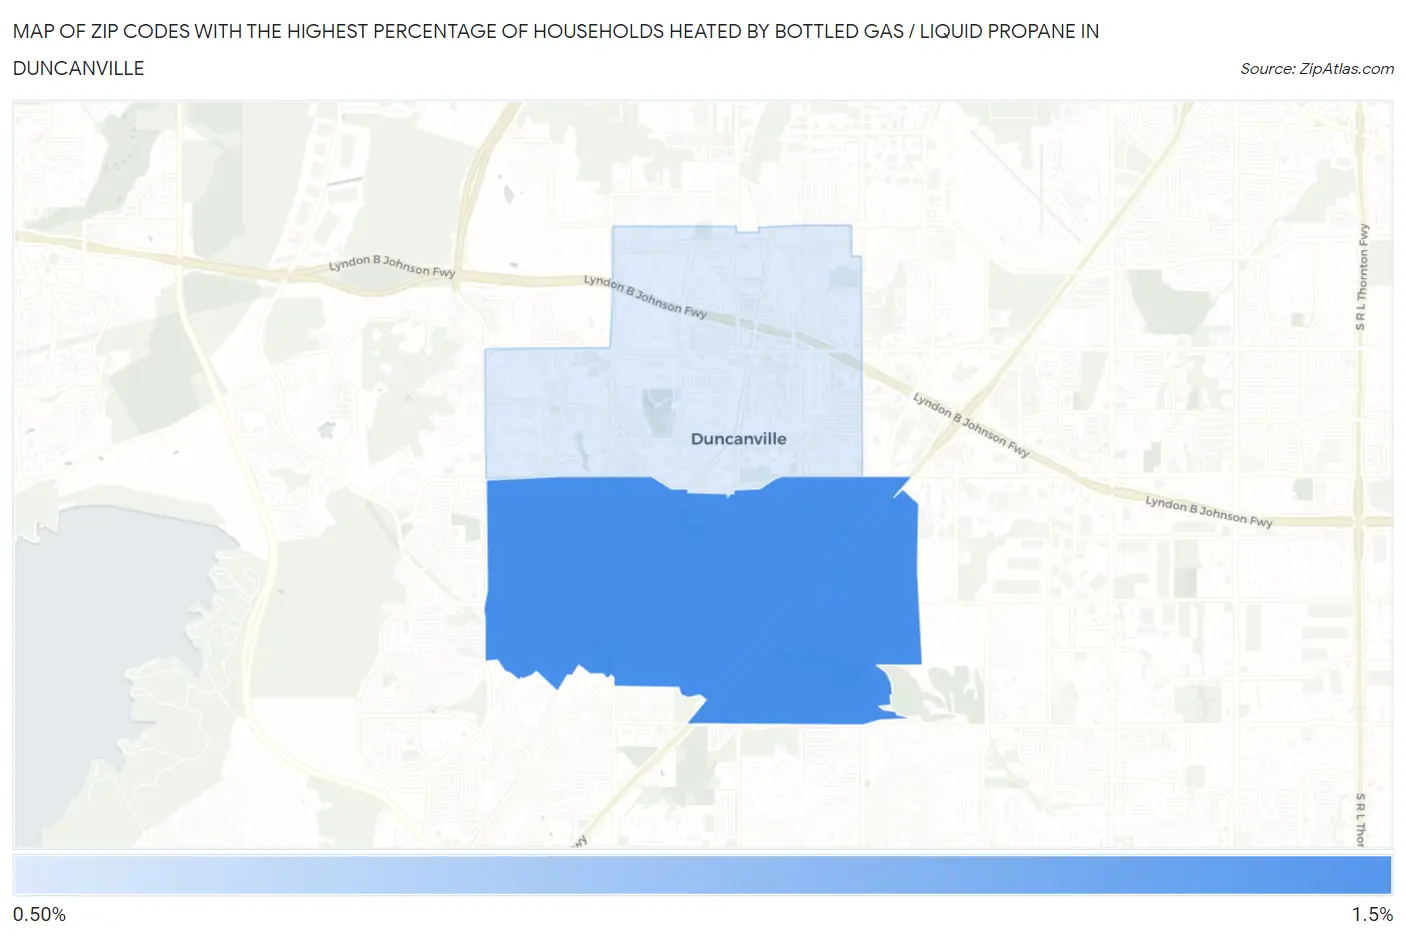
Map of Zip Codes with the Highest Percentage of Households Heated by Bottled Gas / Liquid Propane in Duncanville
0.50%
1.1%
Zip Codes with the Highest Percentage of Households Heated by Bottled Gas / Liquid Propane in Duncanville, TX
| Zip Code | Bottled Gas / LP Heating | vs State | vs National | |
| 1. | 75137 | 1.1% | 2.9%(-1.80)#1,348 | 4.9%(-3.80)#26,326 |
| 2. | 75116 | 0.50% | 2.9%(-2.40)#1,578 | 4.9%(-4.40)#28,658 |
1
Common Questions
What are the Top Zip Codes with the Highest Percentage of Households Heated by Bottled Gas / Liquid Propane in Duncanville, TX?
Top Zip Codes with the Highest Percentage of Households Heated by Bottled Gas / Liquid Propane in Duncanville, TX are:
What zip code has the Highest Percentage of Households Heated by Bottled Gas / Liquid Propane in Duncanville, TX?
75137 has the Highest Percentage of Households Heated by Bottled Gas / Liquid Propane in Duncanville, TX with 1.1%.
What is the Percentage of Households Heated by Bottled Gas / Liquid Propane in Duncanville, TX?
Percentage of Households Heated by Bottled Gas / Liquid Propane in Duncanville is 0.80%.
What is the Percentage of Households Heated by Bottled Gas / Liquid Propane in Texas?
Percentage of Households Heated by Bottled Gas / Liquid Propane in Texas is 2.9%.
What is the Percentage of Households Heated by Bottled Gas / Liquid Propane in the United States?
Percentage of Households Heated by Bottled Gas / Liquid Propane in the United States is 4.9%.