Zip Codes with the Highest Percentage of Population Employed in Food Preparation & Serving in Brownsville, TX
RELATED REPORTS & OPTIONS
Food Preparation & Serving
Brownsville
Compare Zip Codes
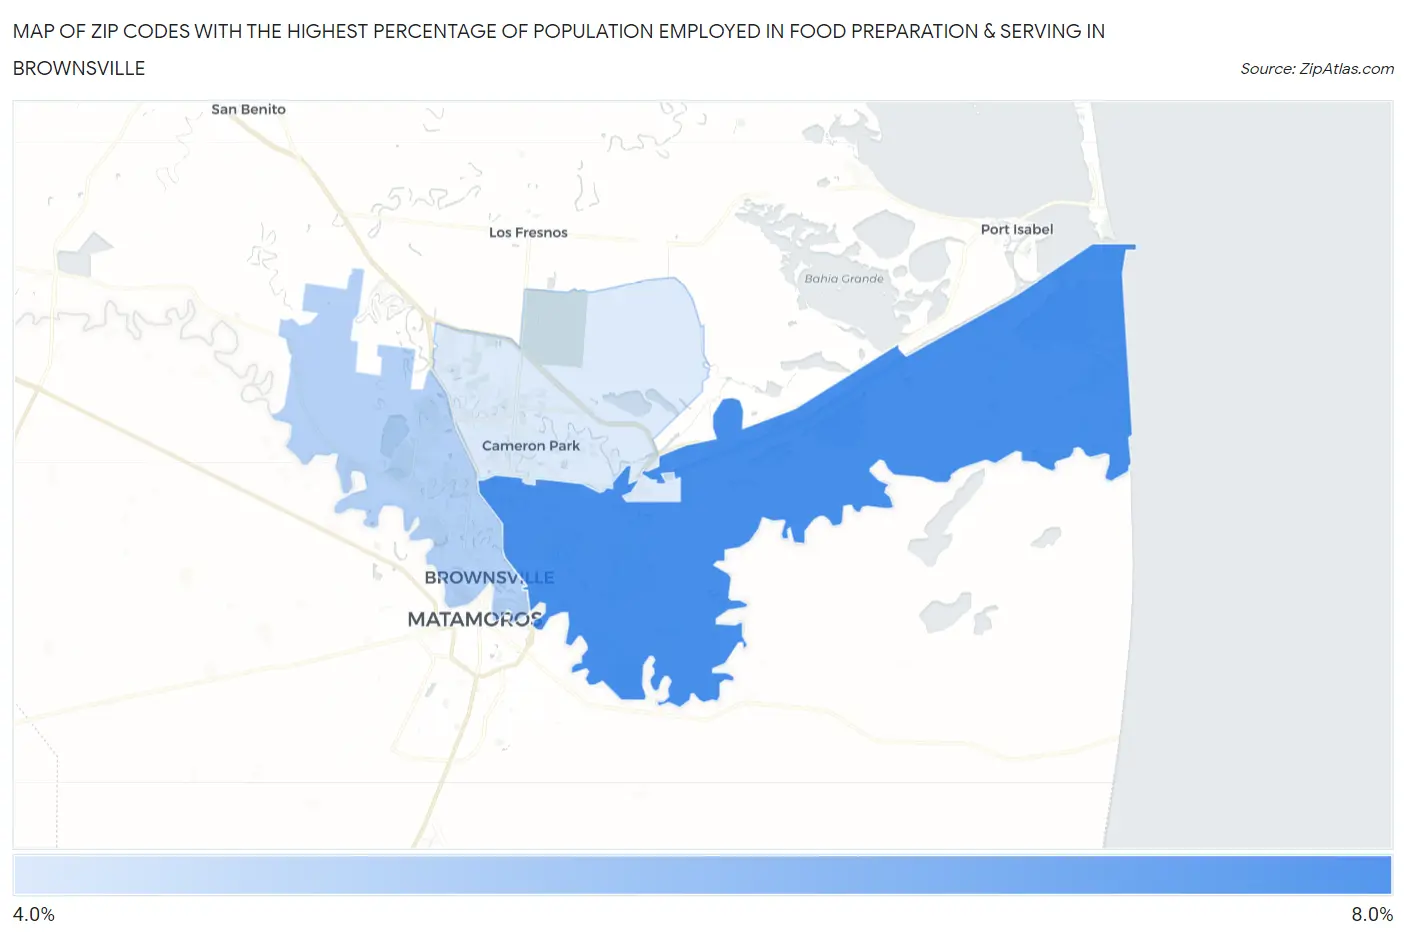
Map of Zip Codes with the Highest Percentage of Population Employed in Food Preparation & Serving in Brownsville
4.9%
6.6%
Zip Codes with the Highest Percentage of Population Employed in Food Preparation & Serving in Brownsville, TX
| Zip Code | % Employed | vs State | vs National | |
| 1. | 78521 | 6.6% | 5.4%(+1.27)#466 | 5.3%(+1.34)#7,546 |
| 2. | 78520 | 5.4% | 5.4%(+0.012)#707 | 5.3%(+0.077)#11,524 |
| 3. | 78526 | 4.9% | 5.4%(-0.458)#834 | 5.3%(-0.393)#13,381 |
1
Common Questions
What are the Top Zip Codes with the Highest Percentage of Population Employed in Food Preparation & Serving in Brownsville, TX?
Top Zip Codes with the Highest Percentage of Population Employed in Food Preparation & Serving in Brownsville, TX are:
What zip code has the Highest Percentage of Population Employed in Food Preparation & Serving in Brownsville, TX?
78521 has the Highest Percentage of Population Employed in Food Preparation & Serving in Brownsville, TX with 6.6%.
What is the Percentage of Population Employed in Food Preparation & Serving in Brownsville, TX?
Percentage of Population Employed in Food Preparation & Serving in Brownsville is 5.7%.
What is the Percentage of Population Employed in Food Preparation & Serving in Texas?
Percentage of Population Employed in Food Preparation & Serving in Texas is 5.4%.
What is the Percentage of Population Employed in Food Preparation & Serving in the United States?
Percentage of Population Employed in Food Preparation & Serving in the United States is 5.3%.