Zip Codes with the Highest Percentage of Population Employed in Food Preparation & Serving in Montgomery, TX
RELATED REPORTS & OPTIONS
Food Preparation & Serving
Montgomery
Compare Zip Codes
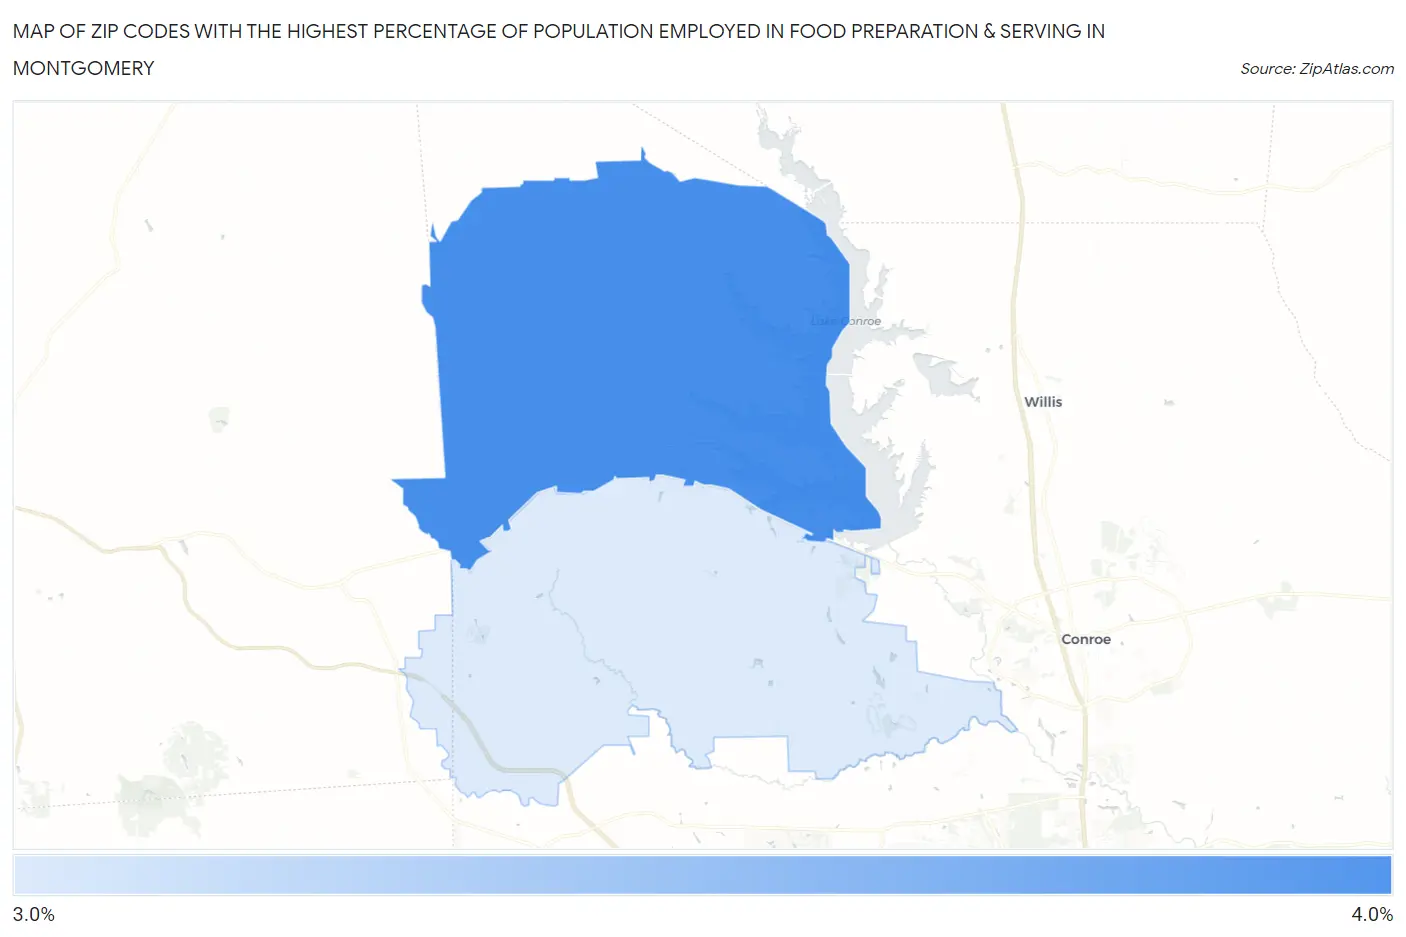
Map of Zip Codes with the Highest Percentage of Population Employed in Food Preparation & Serving in Montgomery
3.2%
3.7%
Zip Codes with the Highest Percentage of Population Employed in Food Preparation & Serving in Montgomery, TX
| Zip Code | % Employed | vs State | vs National | |
| 1. | 77356 | 3.7% | 5.4%(-1.68)#1,120 | 5.3%(-1.62)#18,482 |
| 2. | 77316 | 3.2% | 5.4%(-2.19)#1,226 | 5.3%(-2.12)#20,614 |
1
Common Questions
What are the Top Zip Codes with the Highest Percentage of Population Employed in Food Preparation & Serving in Montgomery, TX?
Top Zip Codes with the Highest Percentage of Population Employed in Food Preparation & Serving in Montgomery, TX are:
What zip code has the Highest Percentage of Population Employed in Food Preparation & Serving in Montgomery, TX?
77356 has the Highest Percentage of Population Employed in Food Preparation & Serving in Montgomery, TX with 3.7%.
What is the Percentage of Population Employed in Food Preparation & Serving in Montgomery, TX?
Percentage of Population Employed in Food Preparation & Serving in Montgomery is 4.3%.
What is the Percentage of Population Employed in Food Preparation & Serving in Texas?
Percentage of Population Employed in Food Preparation & Serving in Texas is 5.4%.
What is the Percentage of Population Employed in Food Preparation & Serving in the United States?
Percentage of Population Employed in Food Preparation & Serving in the United States is 5.3%.