Zip Codes with the Highest Percentage of Population Employed in Food Preparation & Serving in Waco, TX
RELATED REPORTS & OPTIONS
Food Preparation & Serving
Waco
Compare Zip Codes
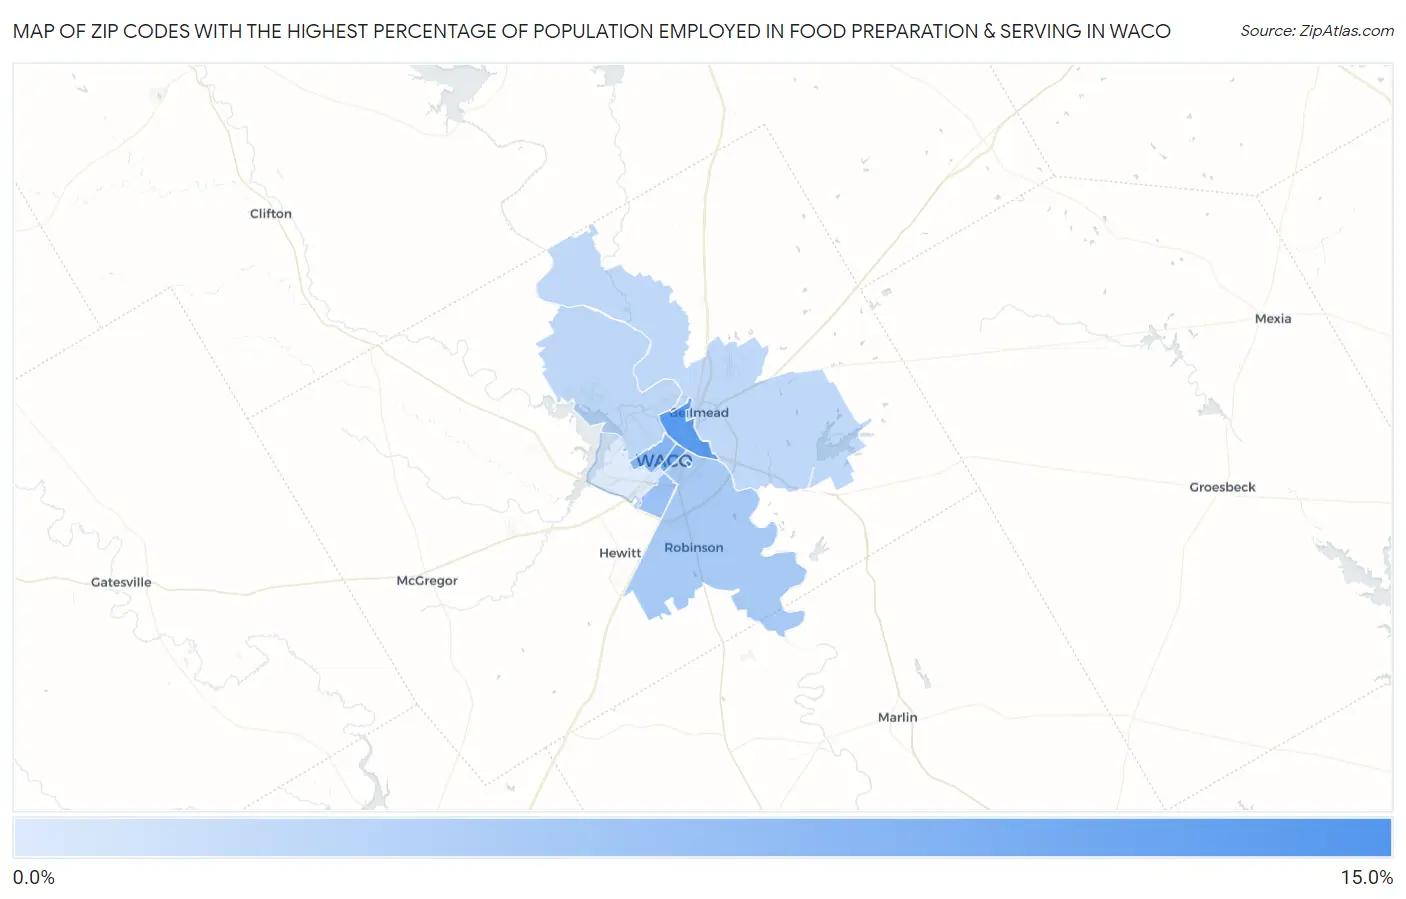
Map of Zip Codes with the Highest Percentage of Population Employed in Food Preparation & Serving in Waco
4.8%
13.5%
Zip Codes with the Highest Percentage of Population Employed in Food Preparation & Serving in Waco, TX
| Zip Code | % Employed | vs State | vs National | |
| 1. | 76798 | 13.5% | 5.4%(+8.16)#71 | 5.3%(+8.22)#1,276 |
| 2. | 76704 | 12.5% | 5.4%(+7.15)#83 | 5.3%(+7.22)#1,509 |
| 3. | 76701 | 11.2% | 5.4%(+5.85)#104 | 5.3%(+5.92)#1,958 |
| 4. | 76707 | 9.7% | 5.4%(+4.36)#153 | 5.3%(+4.42)#2,875 |
| 5. | 76711 | 8.5% | 5.4%(+3.13)#249 | 5.3%(+3.19)#4,091 |
| 6. | 76706 | 7.9% | 5.4%(+2.51)#304 | 5.3%(+2.57)#4,953 |
| 7. | 76708 | 6.6% | 5.4%(+1.29)#462 | 5.3%(+1.35)#7,509 |
| 8. | 76705 | 6.4% | 5.4%(+1.10)#491 | 5.3%(+1.16)#8,010 |
| 9. | 76710 | 4.8% | 5.4%(-0.558)#857 | 5.3%(-0.493)#13,794 |
1
Common Questions
What are the Top 5 Zip Codes with the Highest Percentage of Population Employed in Food Preparation & Serving in Waco, TX?
Top 5 Zip Codes with the Highest Percentage of Population Employed in Food Preparation & Serving in Waco, TX are:
What zip code has the Highest Percentage of Population Employed in Food Preparation & Serving in Waco, TX?
76798 has the Highest Percentage of Population Employed in Food Preparation & Serving in Waco, TX with 13.5%.
What is the Percentage of Population Employed in Food Preparation & Serving in Waco, TX?
Percentage of Population Employed in Food Preparation & Serving in Waco is 7.3%.
What is the Percentage of Population Employed in Food Preparation & Serving in Texas?
Percentage of Population Employed in Food Preparation & Serving in Texas is 5.4%.
What is the Percentage of Population Employed in Food Preparation & Serving in the United States?
Percentage of Population Employed in Food Preparation & Serving in the United States is 5.3%.