Zip Codes with the Highest Percentage of Population Employed in Food Preparation & Serving in Longview, TX
RELATED REPORTS & OPTIONS
Food Preparation & Serving
Longview
Compare Zip Codes
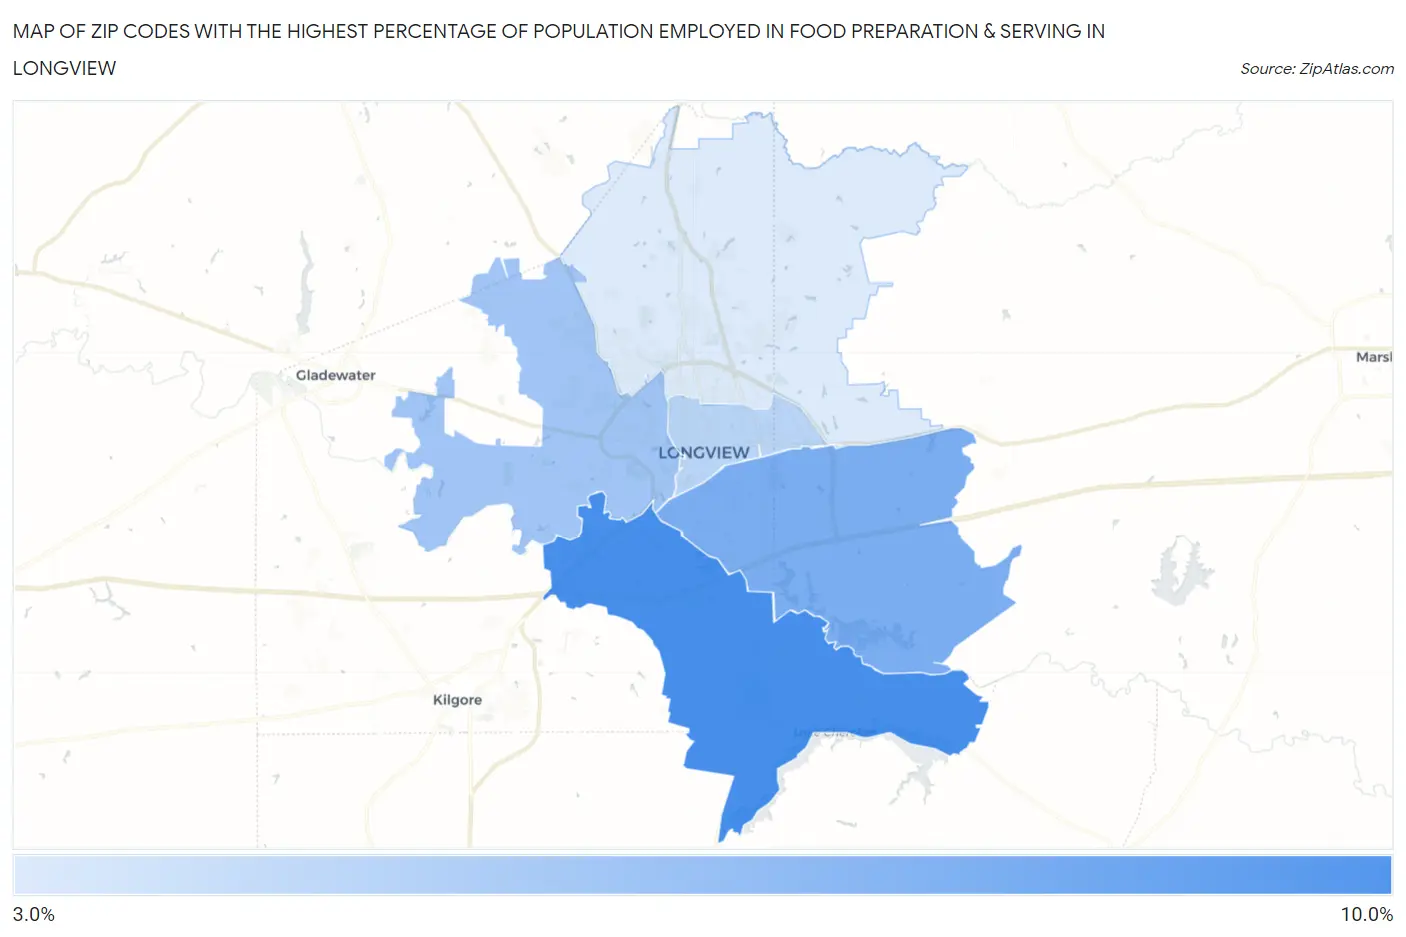
Map of Zip Codes with the Highest Percentage of Population Employed in Food Preparation & Serving in Longview
3.2%
8.2%
Zip Codes with the Highest Percentage of Population Employed in Food Preparation & Serving in Longview, TX
| Zip Code | % Employed | vs State | vs National | |
| 1. | 75603 | 8.2% | 5.4%(+2.80)#274 | 5.3%(+2.87)#4,504 |
| 2. | 75602 | 6.4% | 5.4%(+1.09)#493 | 5.3%(+1.16)#8,026 |
| 3. | 75604 | 5.2% | 5.4%(-0.173)#764 | 5.3%(-0.108)#12,247 |
| 4. | 75601 | 4.3% | 5.4%(-1.01)#955 | 5.3%(-0.945)#15,692 |
| 5. | 75605 | 3.2% | 5.4%(-2.17)#1,222 | 5.3%(-2.11)#20,561 |
1
Common Questions
What are the Top 3 Zip Codes with the Highest Percentage of Population Employed in Food Preparation & Serving in Longview, TX?
Top 3 Zip Codes with the Highest Percentage of Population Employed in Food Preparation & Serving in Longview, TX are:
What zip code has the Highest Percentage of Population Employed in Food Preparation & Serving in Longview, TX?
75603 has the Highest Percentage of Population Employed in Food Preparation & Serving in Longview, TX with 8.2%.
What is the Percentage of Population Employed in Food Preparation & Serving in Longview, TX?
Percentage of Population Employed in Food Preparation & Serving in Longview is 5.0%.
What is the Percentage of Population Employed in Food Preparation & Serving in Texas?
Percentage of Population Employed in Food Preparation & Serving in Texas is 5.4%.
What is the Percentage of Population Employed in Food Preparation & Serving in the United States?
Percentage of Population Employed in Food Preparation & Serving in the United States is 5.3%.