Zip Codes with the Highest Percentage of Population Employed in Food Preparation & Serving in Baytown, TX
RELATED REPORTS & OPTIONS
Food Preparation & Serving
Baytown
Compare Zip Codes
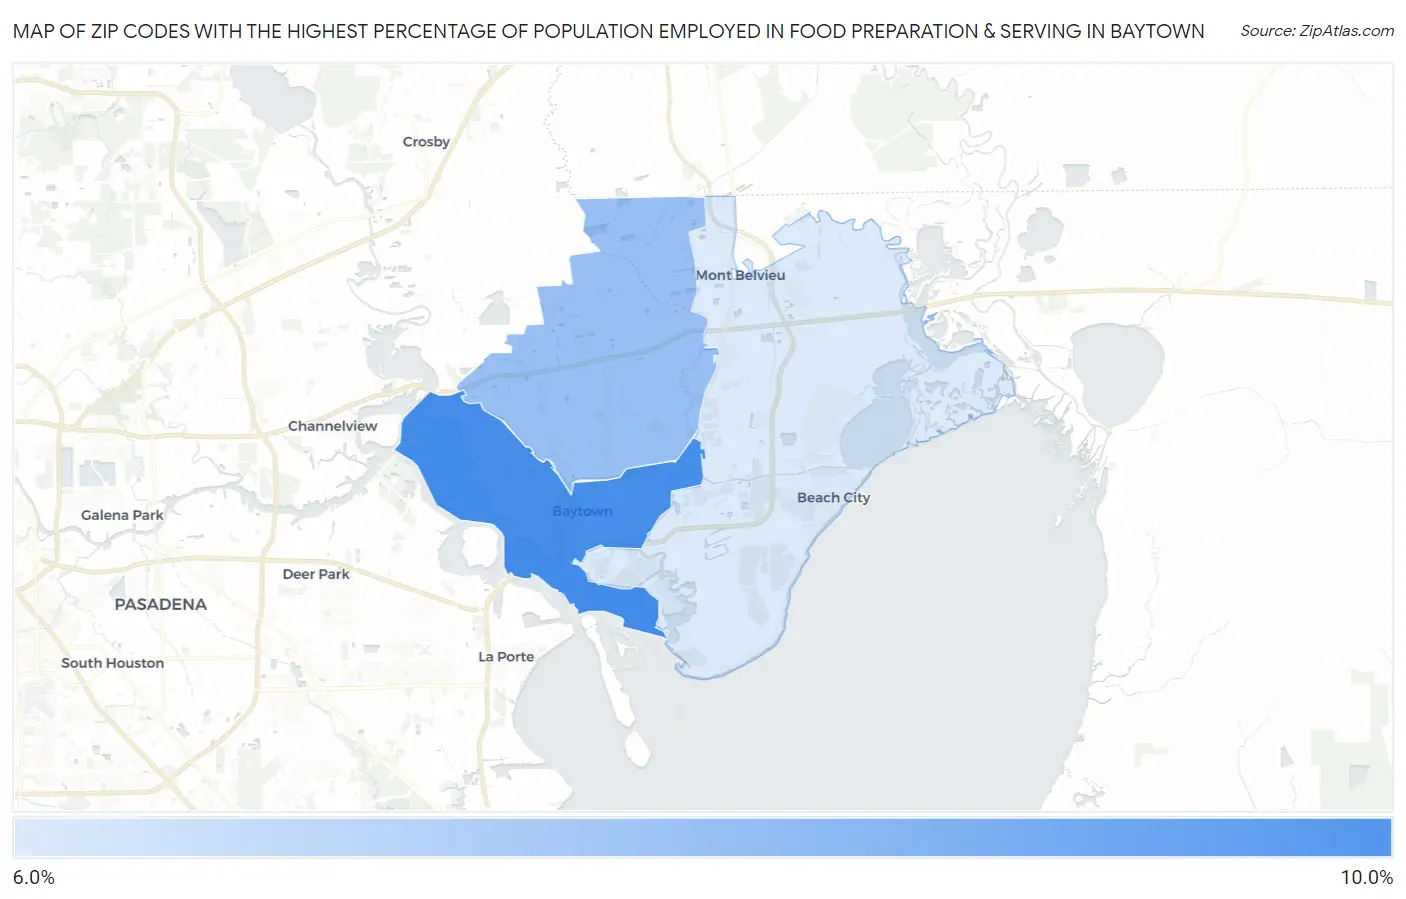
Map of Zip Codes with the Highest Percentage of Population Employed in Food Preparation & Serving in Baytown
6.4%
8.7%
Zip Codes with the Highest Percentage of Population Employed in Food Preparation & Serving in Baytown, TX
| Zip Code | % Employed | vs State | vs National | |
| 1. | 77520 | 8.7% | 5.4%(+3.38)#225 | 5.3%(+3.45)#3,807 |
| 2. | 77521 | 7.5% | 5.4%(+2.12)#348 | 5.3%(+2.18)#5,619 |
| 3. | 77523 | 6.4% | 5.4%(+1.05)#500 | 5.3%(+1.12)#8,138 |
1
Common Questions
What are the Top Zip Codes with the Highest Percentage of Population Employed in Food Preparation & Serving in Baytown, TX?
Top Zip Codes with the Highest Percentage of Population Employed in Food Preparation & Serving in Baytown, TX are:
What zip code has the Highest Percentage of Population Employed in Food Preparation & Serving in Baytown, TX?
77520 has the Highest Percentage of Population Employed in Food Preparation & Serving in Baytown, TX with 8.7%.
What is the Percentage of Population Employed in Food Preparation & Serving in Baytown, TX?
Percentage of Population Employed in Food Preparation & Serving in Baytown is 7.9%.
What is the Percentage of Population Employed in Food Preparation & Serving in Texas?
Percentage of Population Employed in Food Preparation & Serving in Texas is 5.4%.
What is the Percentage of Population Employed in Food Preparation & Serving in the United States?
Percentage of Population Employed in Food Preparation & Serving in the United States is 5.3%.