Zip Codes with the Highest Percentage of Population Employed in Food Preparation & Serving in Richmond, TX
RELATED REPORTS & OPTIONS
Food Preparation & Serving
Richmond
Compare Zip Codes
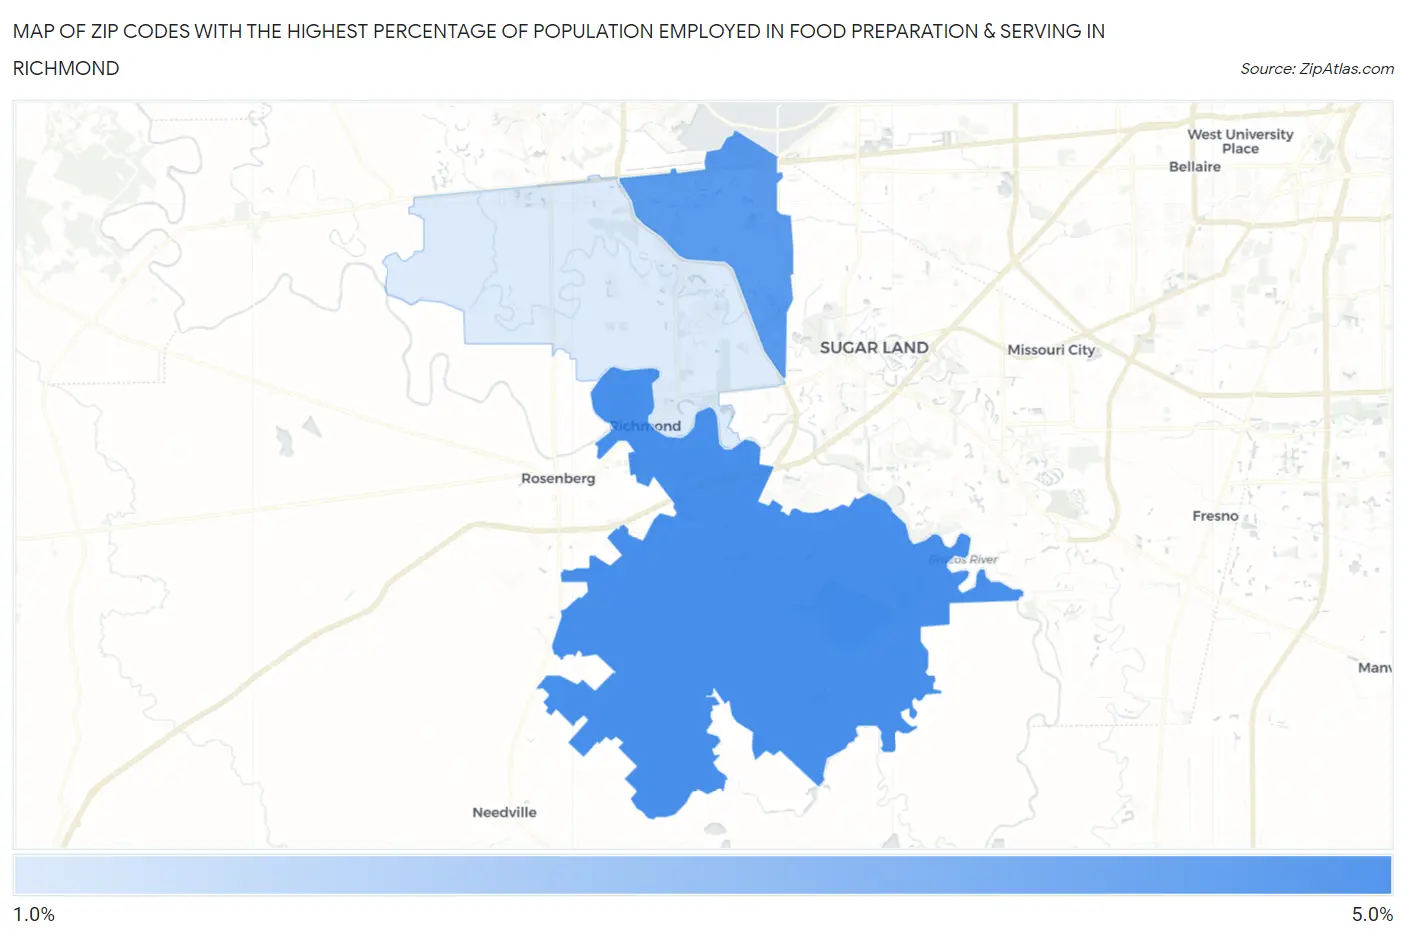
Map of Zip Codes with the Highest Percentage of Population Employed in Food Preparation & Serving in Richmond
1.8%
4.6%
Zip Codes with the Highest Percentage of Population Employed in Food Preparation & Serving in Richmond, TX
| Zip Code | % Employed | vs State | vs National | |
| 1. | 77469 | 4.6% | 5.4%(-0.729)#897 | 5.3%(-0.663)#14,492 |
| 2. | 77407 | 4.3% | 5.4%(-1.05)#963 | 5.3%(-0.983)#15,879 |
| 3. | 77406 | 1.8% | 5.4%(-3.58)#1,471 | 5.3%(-3.52)#25,355 |
1
Common Questions
What are the Top Zip Codes with the Highest Percentage of Population Employed in Food Preparation & Serving in Richmond, TX?
Top Zip Codes with the Highest Percentage of Population Employed in Food Preparation & Serving in Richmond, TX are:
What zip code has the Highest Percentage of Population Employed in Food Preparation & Serving in Richmond, TX?
77469 has the Highest Percentage of Population Employed in Food Preparation & Serving in Richmond, TX with 4.6%.
What is the Percentage of Population Employed in Food Preparation & Serving in Richmond, TX?
Percentage of Population Employed in Food Preparation & Serving in Richmond is 8.5%.
What is the Percentage of Population Employed in Food Preparation & Serving in Texas?
Percentage of Population Employed in Food Preparation & Serving in Texas is 5.4%.
What is the Percentage of Population Employed in Food Preparation & Serving in the United States?
Percentage of Population Employed in Food Preparation & Serving in the United States is 5.3%.