Zip Codes with the Highest Percentage of Population Employed in Food Preparation & Serving in Denton, TX
RELATED REPORTS & OPTIONS
Food Preparation & Serving
Denton
Compare Zip Codes
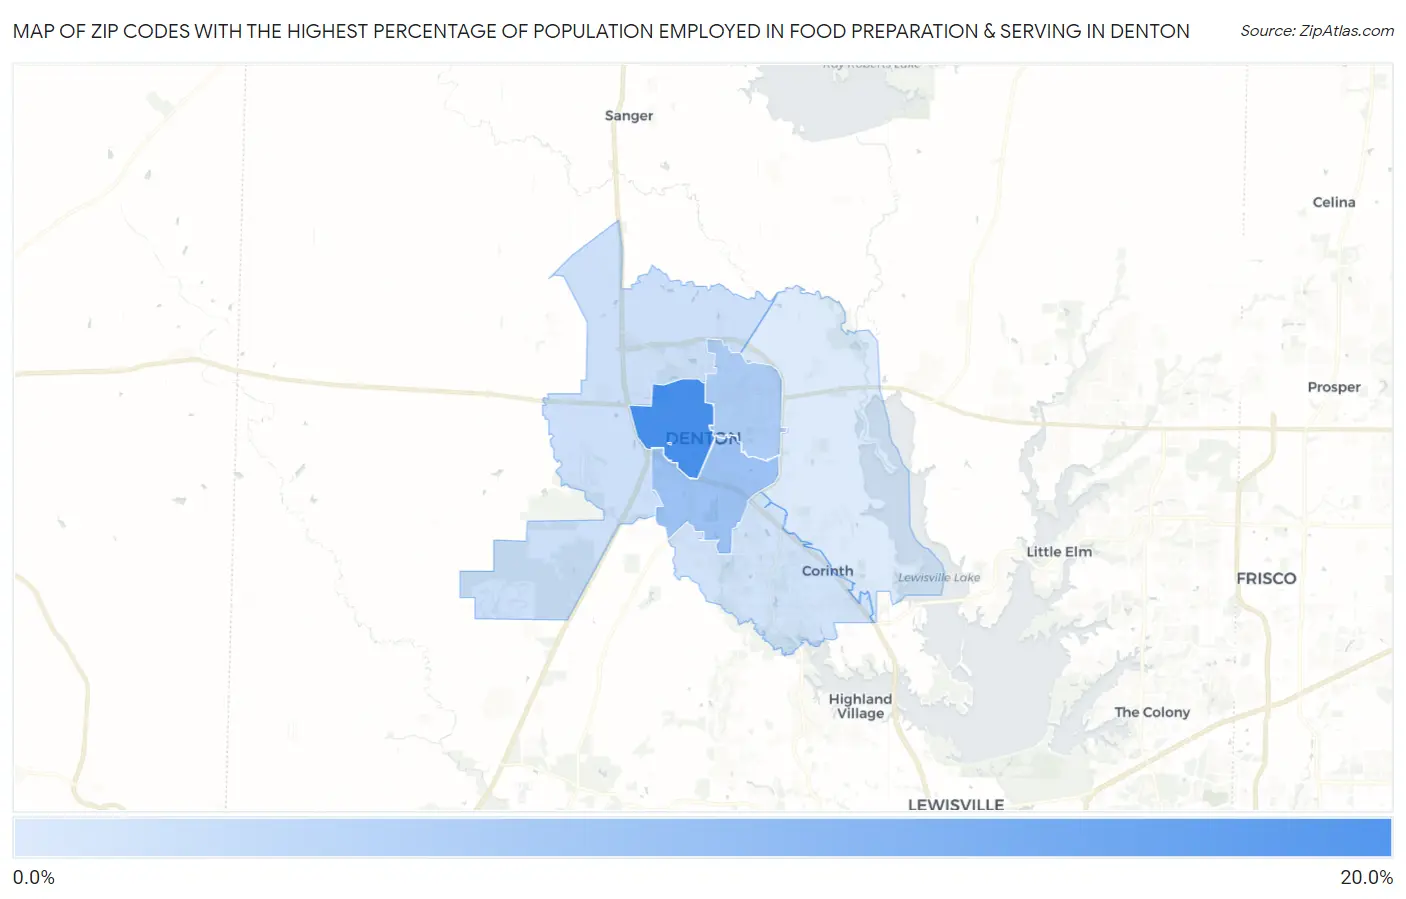
Map of Zip Codes with the Highest Percentage of Population Employed in Food Preparation & Serving in Denton
4.4%
15.1%
Zip Codes with the Highest Percentage of Population Employed in Food Preparation & Serving in Denton, TX
| Zip Code | % Employed | vs State | vs National | |
| 1. | 76201 | 15.1% | 5.4%(+9.70)#53 | 5.3%(+9.77)#974 |
| 2. | 76205 | 9.1% | 5.4%(+3.75)#191 | 5.3%(+3.82)#3,411 |
| 3. | 76209 | 7.7% | 5.4%(+2.38)#319 | 5.3%(+2.45)#5,158 |
| 4. | 76207 | 5.6% | 5.4%(+0.214)#655 | 5.3%(+0.279)#10,829 |
| 5. | 76210 | 5.2% | 5.4%(-0.136)#747 | 5.3%(-0.071)#12,082 |
| 6. | 76208 | 4.4% | 5.4%(-0.958)#945 | 5.3%(-0.893)#15,452 |
1
Common Questions
What are the Top 5 Zip Codes with the Highest Percentage of Population Employed in Food Preparation & Serving in Denton, TX?
Top 5 Zip Codes with the Highest Percentage of Population Employed in Food Preparation & Serving in Denton, TX are:
What zip code has the Highest Percentage of Population Employed in Food Preparation & Serving in Denton, TX?
76201 has the Highest Percentage of Population Employed in Food Preparation & Serving in Denton, TX with 15.1%.
What is the Percentage of Population Employed in Food Preparation & Serving in Denton, TX?
Percentage of Population Employed in Food Preparation & Serving in Denton is 8.3%.
What is the Percentage of Population Employed in Food Preparation & Serving in Texas?
Percentage of Population Employed in Food Preparation & Serving in Texas is 5.4%.
What is the Percentage of Population Employed in Food Preparation & Serving in the United States?
Percentage of Population Employed in Food Preparation & Serving in the United States is 5.3%.