Zip Codes with the Highest Percentage of Population Employed in Business & Financial in Brownsville, TX
RELATED REPORTS & OPTIONS
Business & Financial
Brownsville
Compare Zip Codes
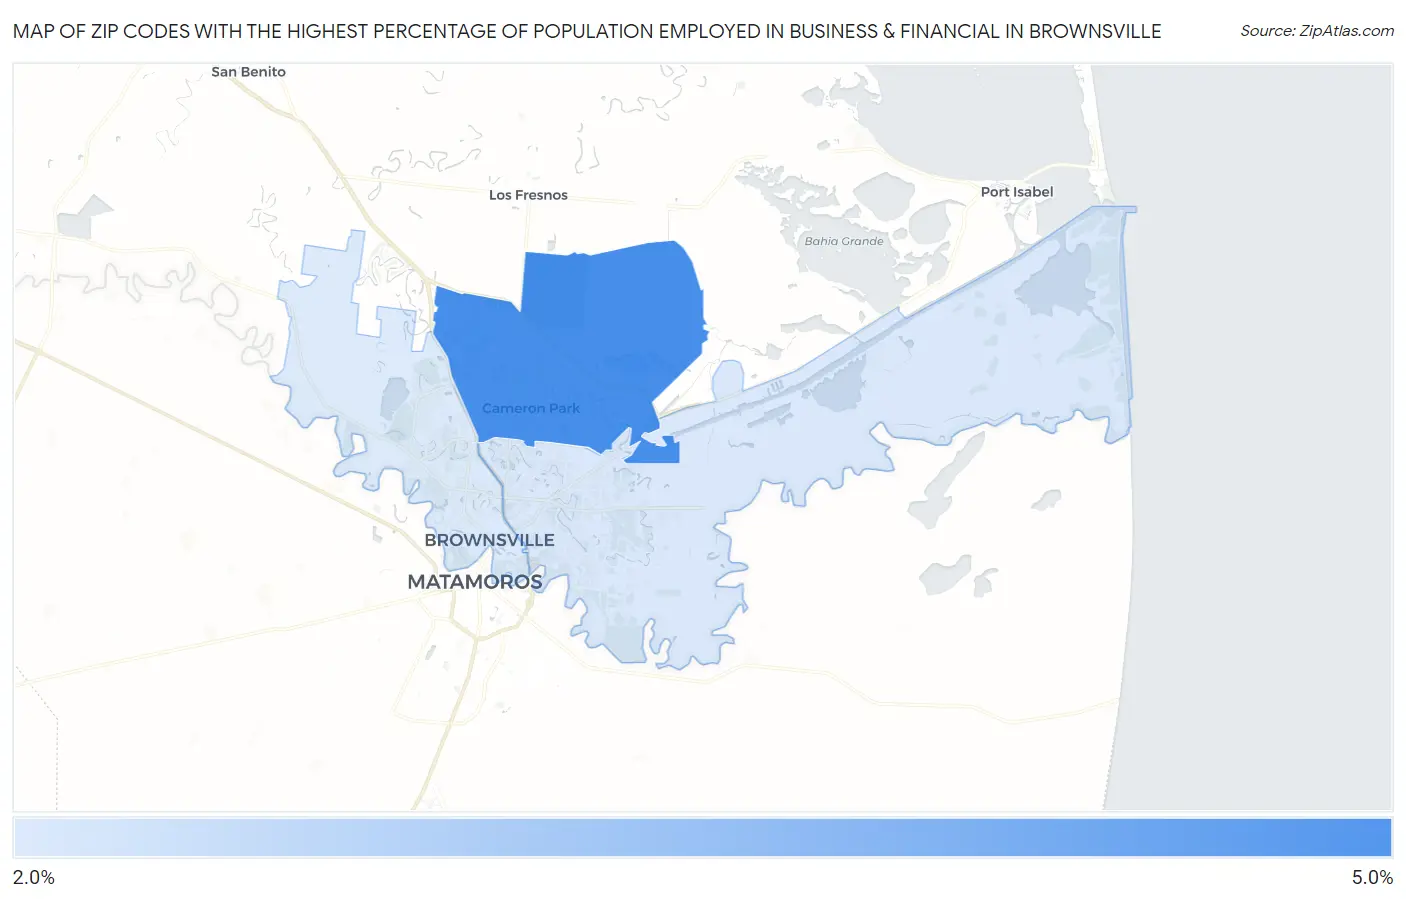
Map of Zip Codes with the Highest Percentage of Population Employed in Business & Financial in Brownsville
2.0%
4.4%
Zip Codes with the Highest Percentage of Population Employed in Business & Financial in Brownsville, TX
| Zip Code | % Employed | vs State | vs National | |
| 1. | 78526 | 4.4% | 5.7%(-1.29)#648 | 5.8%(-1.35)#12,395 |
| 2. | 78521 | 2.1% | 5.7%(-3.63)#1,187 | 5.8%(-3.69)#21,537 |
| 3. | 78520 | 2.0% | 5.7%(-3.67)#1,198 | 5.8%(-3.73)#21,670 |
1
Common Questions
What are the Top Zip Codes with the Highest Percentage of Population Employed in Business & Financial in Brownsville, TX?
Top Zip Codes with the Highest Percentage of Population Employed in Business & Financial in Brownsville, TX are:
What zip code has the Highest Percentage of Population Employed in Business & Financial in Brownsville, TX?
78526 has the Highest Percentage of Population Employed in Business & Financial in Brownsville, TX with 4.4%.
What is the Percentage of Population Employed in Business & Financial in Brownsville, TX?
Percentage of Population Employed in Business & Financial in Brownsville is 3.0%.
What is the Percentage of Population Employed in Business & Financial in Texas?
Percentage of Population Employed in Business & Financial in Texas is 5.7%.
What is the Percentage of Population Employed in Business & Financial in the United States?
Percentage of Population Employed in Business & Financial in the United States is 5.8%.