Zip Codes with the Highest Percentage of Population Employed in Food Preparation & Serving in Sherman, TX
RELATED REPORTS & OPTIONS
Food Preparation & Serving
Sherman
Compare Zip Codes
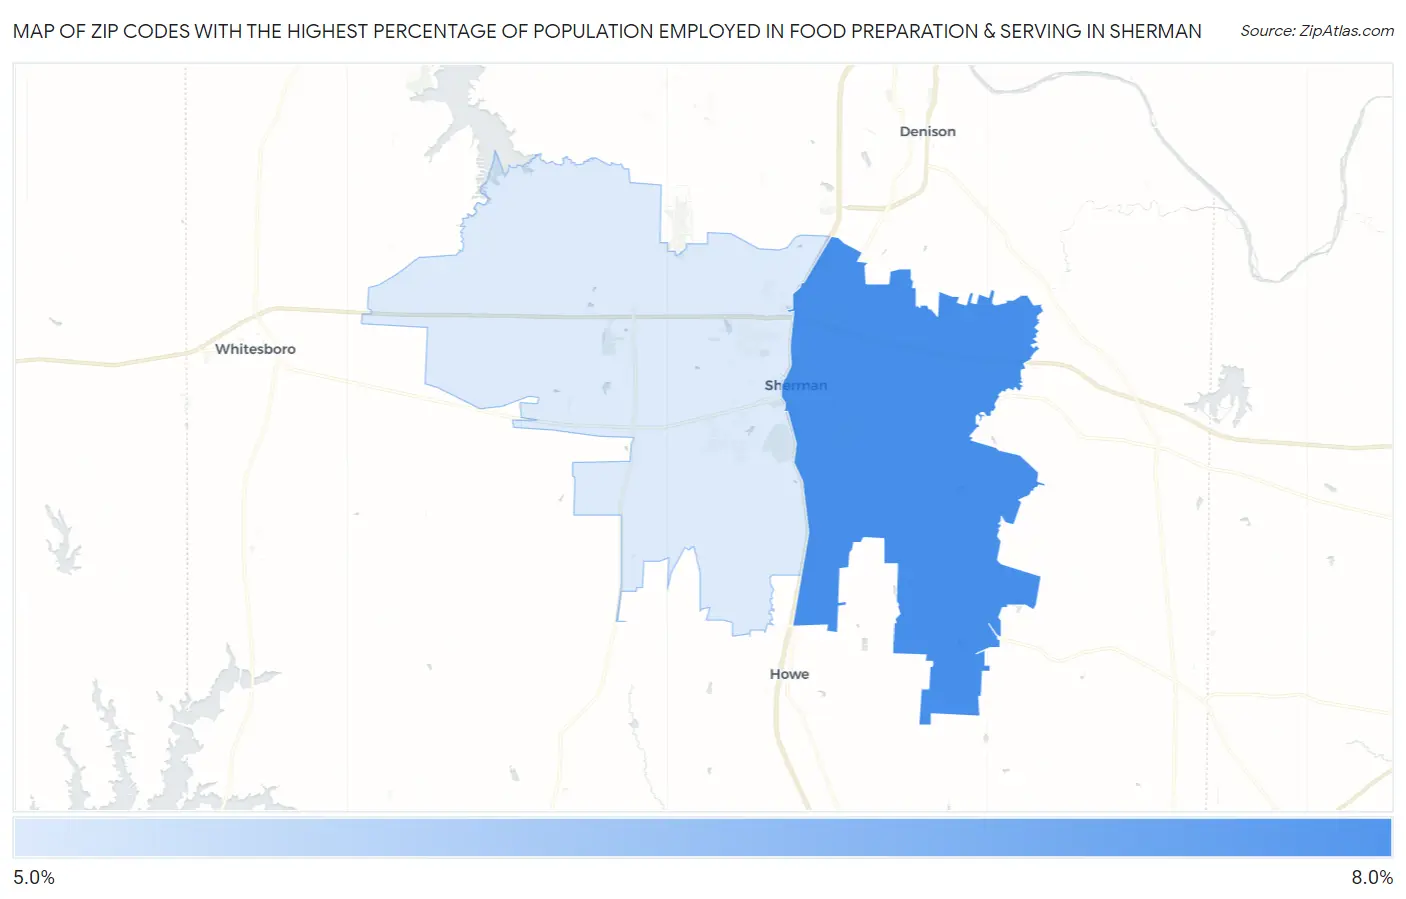
Map of Zip Codes with the Highest Percentage of Population Employed in Food Preparation & Serving in Sherman
5.5%
6.8%
Zip Codes with the Highest Percentage of Population Employed in Food Preparation & Serving in Sherman, TX
| Zip Code | % Employed | vs State | vs National | |
| 1. | 75090 | 6.8% | 5.4%(+1.47)#434 | 5.3%(+1.54)#7,003 |
| 2. | 75092 | 5.5% | 5.4%(+0.137)#676 | 5.3%(+0.202)#11,104 |
1
Common Questions
What are the Top Zip Codes with the Highest Percentage of Population Employed in Food Preparation & Serving in Sherman, TX?
Top Zip Codes with the Highest Percentage of Population Employed in Food Preparation & Serving in Sherman, TX are:
What zip code has the Highest Percentage of Population Employed in Food Preparation & Serving in Sherman, TX?
75090 has the Highest Percentage of Population Employed in Food Preparation & Serving in Sherman, TX with 6.8%.
What is the Percentage of Population Employed in Food Preparation & Serving in Sherman, TX?
Percentage of Population Employed in Food Preparation & Serving in Sherman is 6.5%.
What is the Percentage of Population Employed in Food Preparation & Serving in Texas?
Percentage of Population Employed in Food Preparation & Serving in Texas is 5.4%.
What is the Percentage of Population Employed in Food Preparation & Serving in the United States?
Percentage of Population Employed in Food Preparation & Serving in the United States is 5.3%.