Zip Codes with the Highest Percentage of Population Employed in Food Preparation & Serving in Victoria, TX
RELATED REPORTS & OPTIONS
Food Preparation & Serving
Victoria
Compare Zip Codes
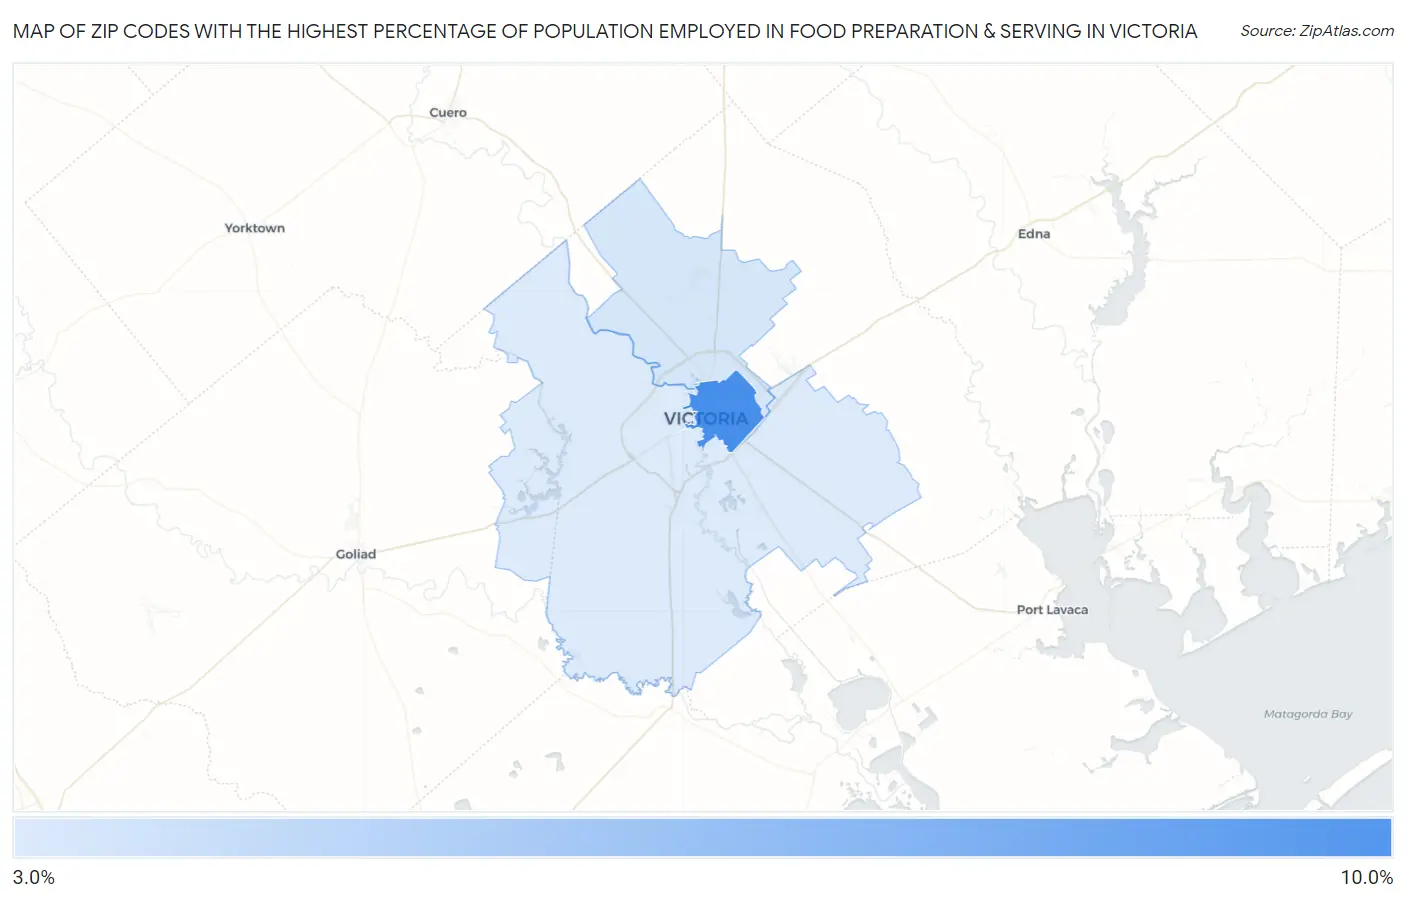
Map of Zip Codes with the Highest Percentage of Population Employed in Food Preparation & Serving in Victoria
3.1%
9.0%
Zip Codes with the Highest Percentage of Population Employed in Food Preparation & Serving in Victoria, TX
| Zip Code | % Employed | vs State | vs National | |
| 1. | 77901 | 9.0% | 5.4%(+3.69)#197 | 5.3%(+3.76)#3,479 |
| 2. | 77904 | 3.4% | 5.4%(-1.94)#1,171 | 5.3%(-1.87)#19,570 |
| 3. | 77905 | 3.1% | 5.4%(-2.23)#1,239 | 5.3%(-2.17)#20,807 |
1
Common Questions
What are the Top Zip Codes with the Highest Percentage of Population Employed in Food Preparation & Serving in Victoria, TX?
Top Zip Codes with the Highest Percentage of Population Employed in Food Preparation & Serving in Victoria, TX are:
What zip code has the Highest Percentage of Population Employed in Food Preparation & Serving in Victoria, TX?
77901 has the Highest Percentage of Population Employed in Food Preparation & Serving in Victoria, TX with 9.0%.
What is the Percentage of Population Employed in Food Preparation & Serving in Victoria, TX?
Percentage of Population Employed in Food Preparation & Serving in Victoria is 6.7%.
What is the Percentage of Population Employed in Food Preparation & Serving in Texas?
Percentage of Population Employed in Food Preparation & Serving in Texas is 5.4%.
What is the Percentage of Population Employed in Food Preparation & Serving in the United States?
Percentage of Population Employed in Food Preparation & Serving in the United States is 5.3%.