Zip Codes with the Highest Percentage of Population Employed in Food Preparation & Serving in Tyler, TX
RELATED REPORTS & OPTIONS
Food Preparation & Serving
Tyler
Compare Zip Codes
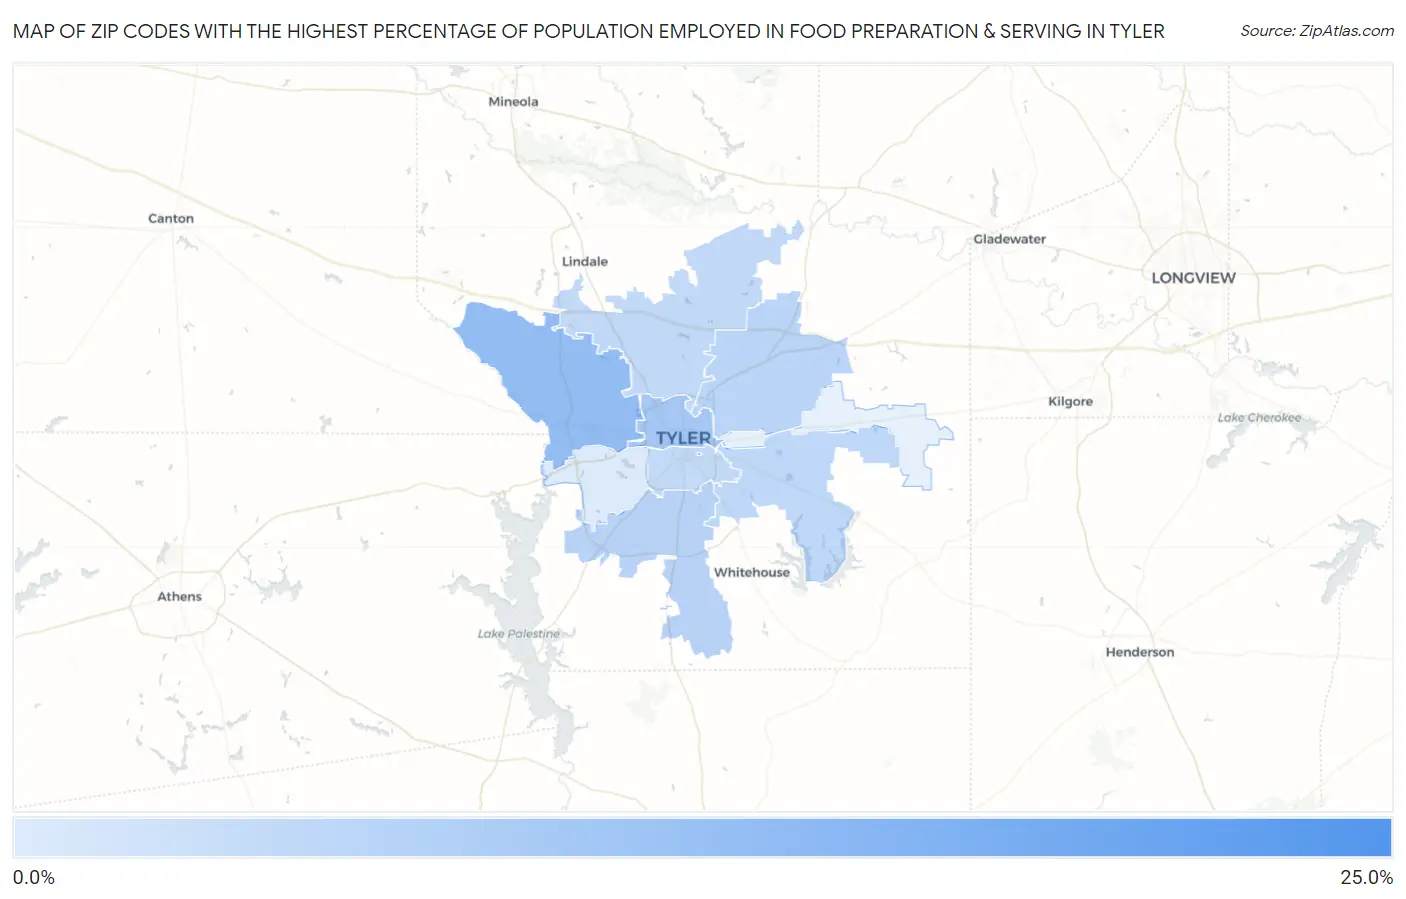
Map of Zip Codes with the Highest Percentage of Population Employed in Food Preparation & Serving in Tyler
0.51%
24.1%
Zip Codes with the Highest Percentage of Population Employed in Food Preparation & Serving in Tyler, TX
| Zip Code | % Employed | vs State | vs National | |
| 1. | 75711 | 24.1% | 5.4%(+18.7)#19 | 5.3%(+18.8)#338 |
| 2. | 75704 | 11.4% | 5.4%(+6.03)#102 | 5.3%(+6.09)#1,884 |
| 3. | 75702 | 8.5% | 5.4%(+3.15)#245 | 5.3%(+3.21)#4,077 |
| 4. | 75703 | 5.9% | 5.4%(+0.575)#584 | 5.3%(+0.640)#9,585 |
| 5. | 75708 | 5.7% | 5.4%(+0.319)#630 | 5.3%(+0.384)#10,451 |
| 6. | 75707 | 5.0% | 5.4%(-0.368)#813 | 5.3%(-0.303)#13,015 |
| 7. | 75706 | 4.6% | 5.4%(-0.790)#913 | 5.3%(-0.725)#14,783 |
| 8. | 75701 | 4.1% | 5.4%(-1.23)#1,010 | 5.3%(-1.17)#16,636 |
| 9. | 75709 | 0.51% | 5.4%(-4.84)#1,593 | 5.3%(-4.78)#27,686 |
1
Common Questions
What are the Top 5 Zip Codes with the Highest Percentage of Population Employed in Food Preparation & Serving in Tyler, TX?
Top 5 Zip Codes with the Highest Percentage of Population Employed in Food Preparation & Serving in Tyler, TX are:
What zip code has the Highest Percentage of Population Employed in Food Preparation & Serving in Tyler, TX?
75711 has the Highest Percentage of Population Employed in Food Preparation & Serving in Tyler, TX with 24.1%.
What is the Percentage of Population Employed in Food Preparation & Serving in Tyler, TX?
Percentage of Population Employed in Food Preparation & Serving in Tyler is 5.3%.
What is the Percentage of Population Employed in Food Preparation & Serving in Texas?
Percentage of Population Employed in Food Preparation & Serving in Texas is 5.4%.
What is the Percentage of Population Employed in Food Preparation & Serving in the United States?
Percentage of Population Employed in Food Preparation & Serving in the United States is 5.3%.