Zip Codes with the Highest Percentage of Population Employed in Food Preparation & Serving in Pearland, TX
RELATED REPORTS & OPTIONS
Food Preparation & Serving
Pearland
Compare Zip Codes
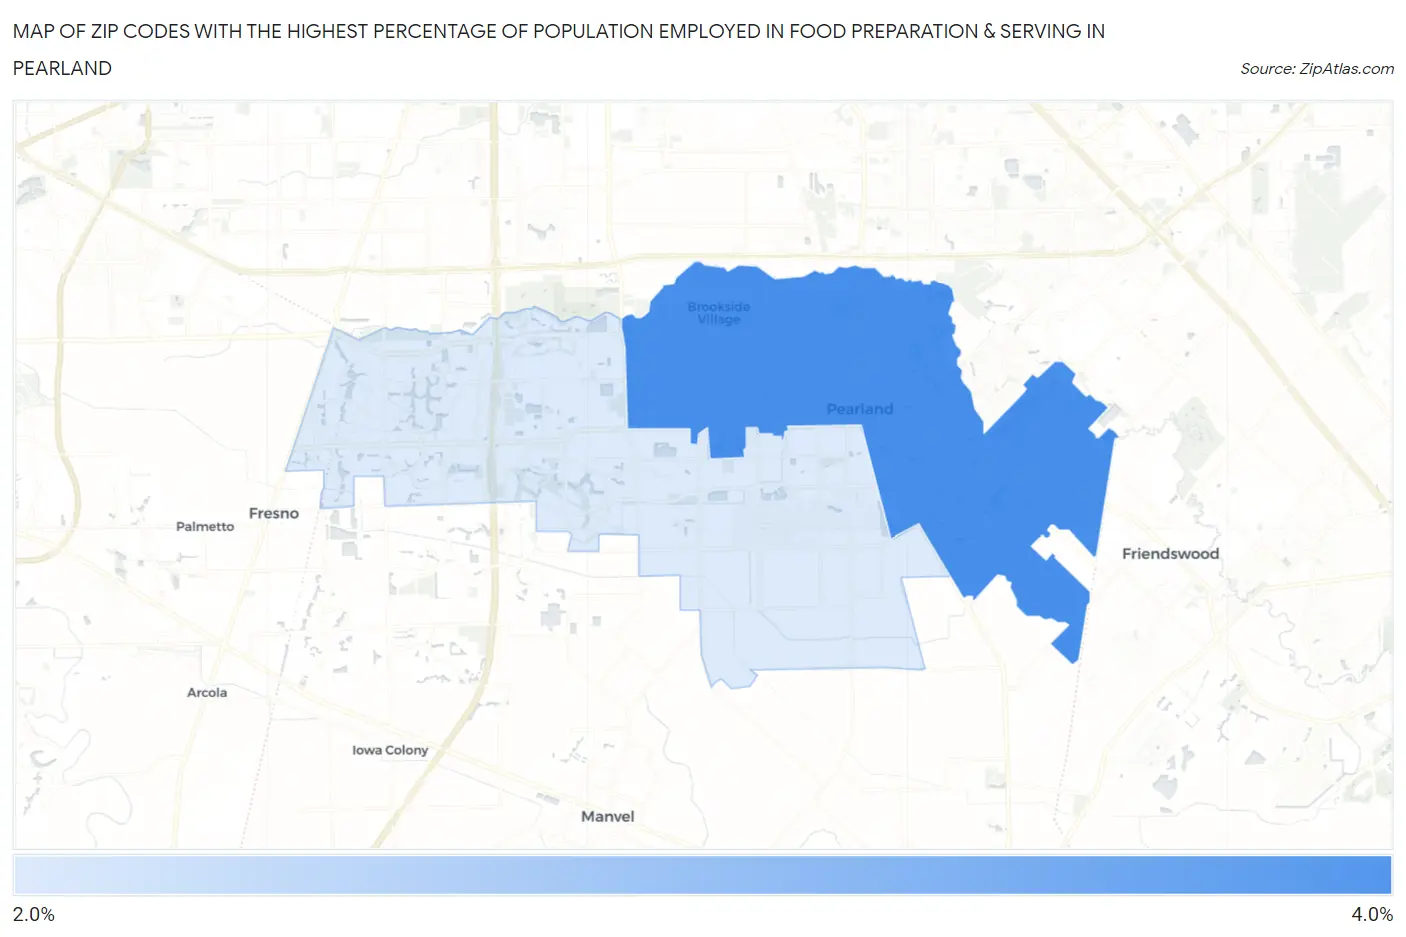
Map of Zip Codes with the Highest Percentage of Population Employed in Food Preparation & Serving in Pearland
2.8%
3.1%
Zip Codes with the Highest Percentage of Population Employed in Food Preparation & Serving in Pearland, TX
| Zip Code | % Employed | vs State | vs National | |
| 1. | 77581 | 3.1% | 5.4%(-2.26)#1,247 | 5.3%(-2.19)#20,902 |
| 2. | 77584 | 2.8% | 5.4%(-2.54)#1,303 | 5.3%(-2.47)#22,017 |
1
Common Questions
What are the Top Zip Codes with the Highest Percentage of Population Employed in Food Preparation & Serving in Pearland, TX?
Top Zip Codes with the Highest Percentage of Population Employed in Food Preparation & Serving in Pearland, TX are:
What zip code has the Highest Percentage of Population Employed in Food Preparation & Serving in Pearland, TX?
77581 has the Highest Percentage of Population Employed in Food Preparation & Serving in Pearland, TX with 3.1%.
What is the Percentage of Population Employed in Food Preparation & Serving in Pearland, TX?
Percentage of Population Employed in Food Preparation & Serving in Pearland is 2.8%.
What is the Percentage of Population Employed in Food Preparation & Serving in Texas?
Percentage of Population Employed in Food Preparation & Serving in Texas is 5.4%.
What is the Percentage of Population Employed in Food Preparation & Serving in the United States?
Percentage of Population Employed in Food Preparation & Serving in the United States is 5.3%.