Zip Codes with the Highest Percentage of Families with Income Above $100,000 in Brownsville, TX
RELATED REPORTS & OPTIONS
Family Income | $100k+
Brownsville
Compare Zip Codes
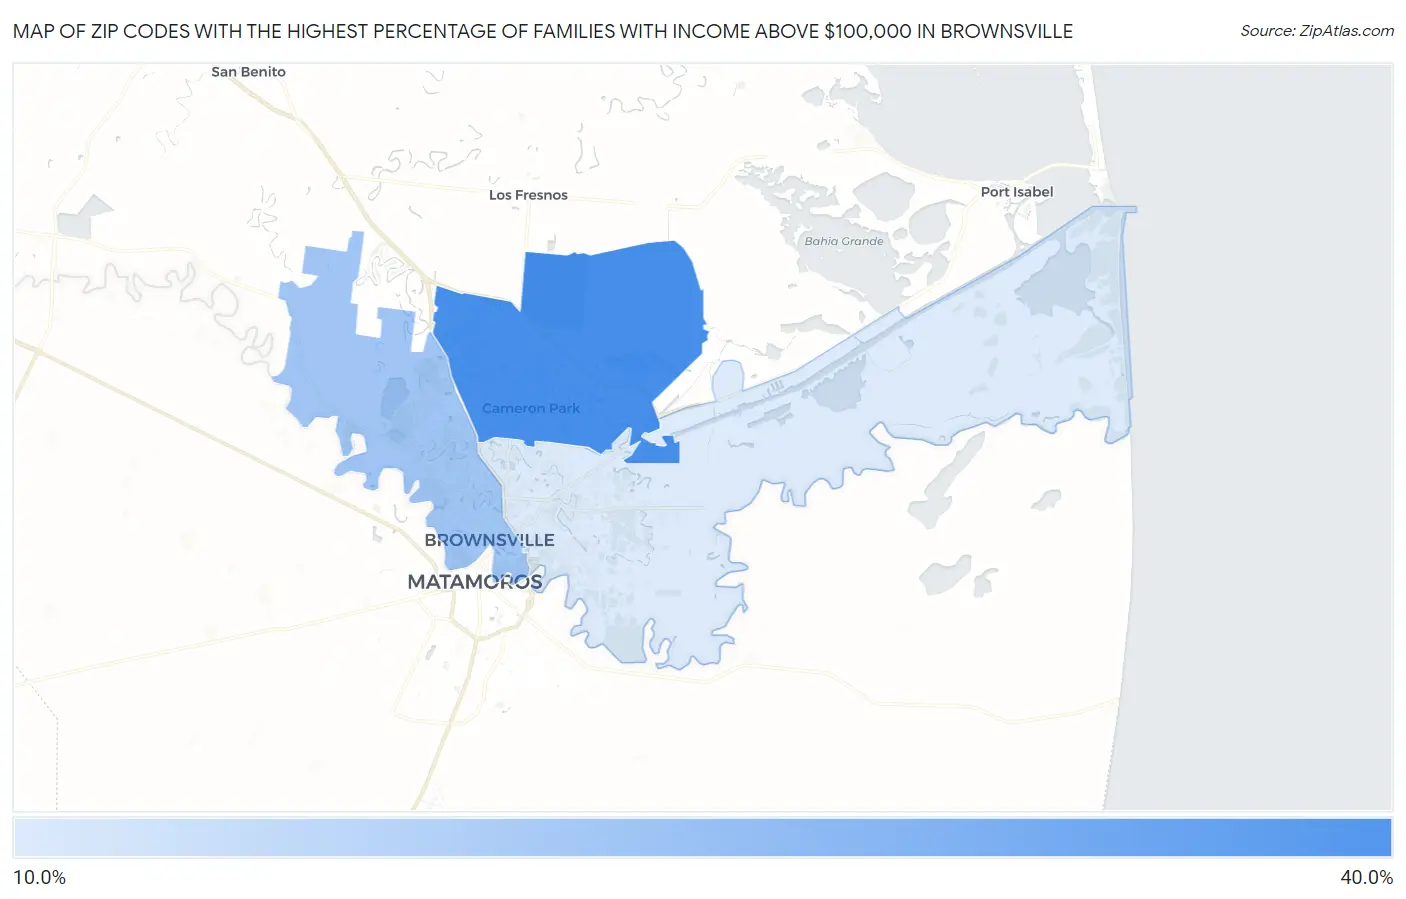
Map of Zip Codes with the Highest Percentage of Families with Income Above $100,000 in Brownsville
13.6%
32.0%
Zip Codes with the Highest Percentage of Families with Income Above $100,000 in Brownsville, TX
| Zip Code | Families with Income > $100k | vs State | vs National | |
| 1. | 78526 | 32.0% | 43.7%(-11.7)#1,099 | 46.1%(-14.1)#20,014 |
| 2. | 78520 | 20.6% | 43.7%(-23.1)#1,551 | 46.1%(-25.5)#26,953 |
| 3. | 78521 | 13.6% | 43.7%(-30.1)#1,706 | 46.1%(-32.5)#29,492 |
1
Common Questions
What are the Top Zip Codes with the Highest Percentage of Families with Income Above $100,000 in Brownsville, TX?
Top Zip Codes with the Highest Percentage of Families with Income Above $100,000 in Brownsville, TX are:
What zip code has the Highest Percentage of Families with Income Above $100,000 in Brownsville, TX?
78526 has the Highest Percentage of Families with Income Above $100,000 in Brownsville, TX with 32.0%.
What is the Percentage of Families with Income Above $100,000 in Brownsville, TX?
Percentage of Families with Income Above $100,000 in Brownsville is 21.5%.
What is the Percentage of Families with Income Above $100,000 in Texas?
Percentage of Families with Income Above $100,000 in Texas is 43.7%.
What is the Percentage of Families with Income Above $100,000 in the United States?
Percentage of Families with Income Above $100,000 in the United States is 46.1%.