Zip Codes with the Highest Percentage of Population Employed in Food Preparation & Serving in Dallas, TX
RELATED REPORTS & OPTIONS
Food Preparation & Serving
Dallas
Compare Zip Codes
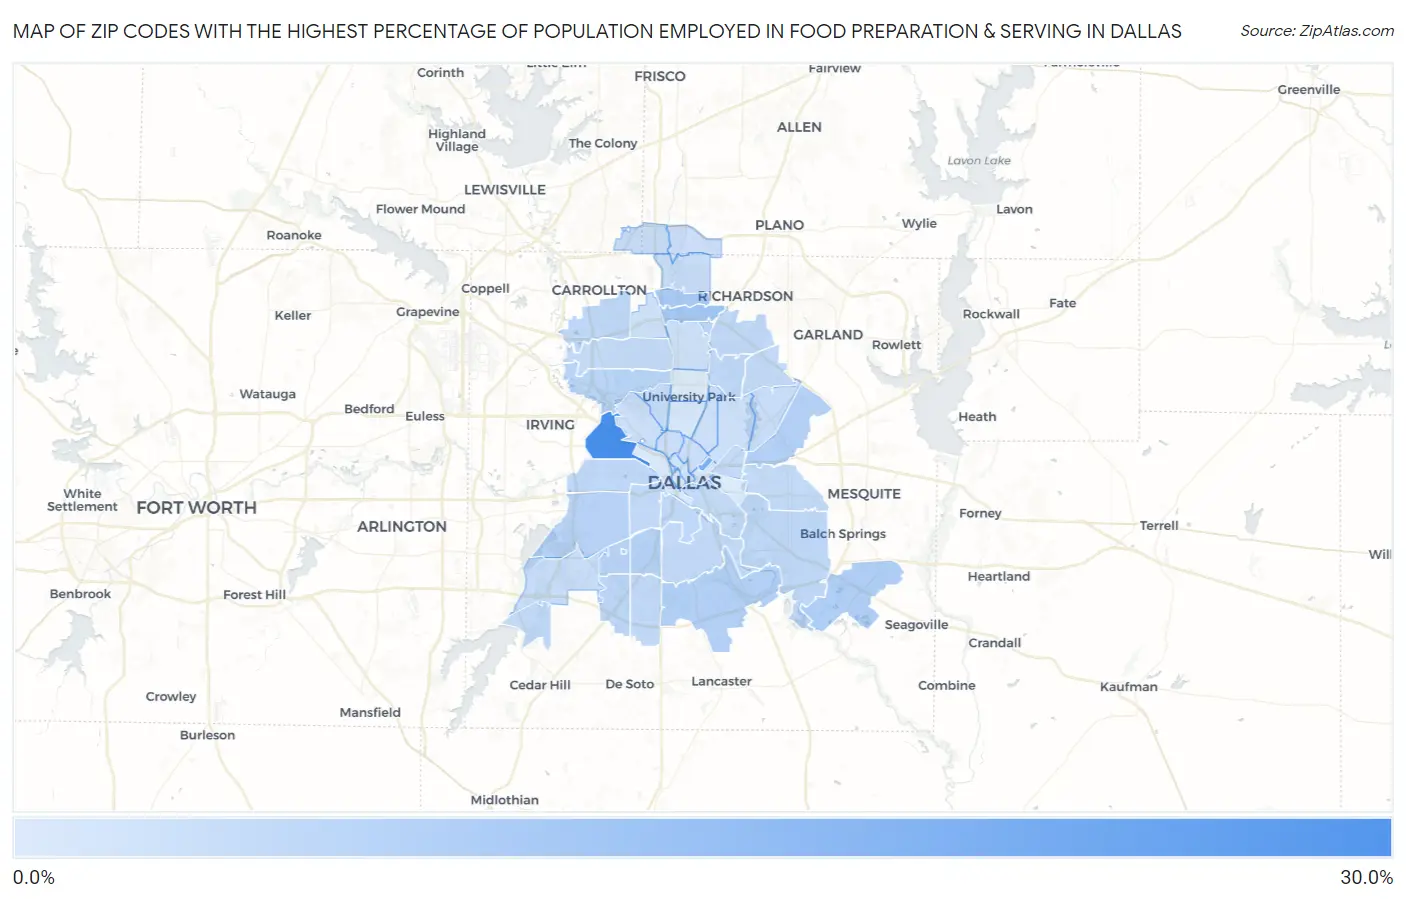
Map of Zip Codes with the Highest Percentage of Population Employed in Food Preparation & Serving in Dallas
0.59%
29.8%
Zip Codes with the Highest Percentage of Population Employed in Food Preparation & Serving in Dallas, TX
| Zip Code | % Employed | vs State | vs National | |
| 1. | 75247 | 29.8% | 5.4%(+24.4)#12 | 5.3%(+24.5)#216 |
| 2. | 75246 | 18.1% | 5.4%(+12.8)#36 | 5.3%(+12.8)#646 |
| 3. | 75240 | 10.9% | 5.4%(+5.58)#113 | 5.3%(+5.64)#2,089 |
| 4. | 75254 | 9.4% | 5.4%(+4.08)#167 | 5.3%(+4.15)#3,109 |
| 5. | 75253 | 8.3% | 5.4%(+2.98)#259 | 5.3%(+3.04)#4,280 |
| 6. | 75228 | 8.0% | 5.4%(+2.66)#294 | 5.3%(+2.72)#4,716 |
| 7. | 75241 | 7.9% | 5.4%(+2.60)#297 | 5.3%(+2.66)#4,811 |
| 8. | 75224 | 7.5% | 5.4%(+2.11)#349 | 5.3%(+2.17)#5,637 |
| 9. | 75211 | 7.2% | 5.4%(+1.82)#390 | 5.3%(+1.89)#6,183 |
| 10. | 75233 | 7.1% | 5.4%(+1.70)#405 | 5.3%(+1.77)#6,431 |
| 11. | 75220 | 6.8% | 5.4%(+1.44)#439 | 5.3%(+1.50)#7,093 |
| 12. | 75251 | 6.7% | 5.4%(+1.37)#448 | 5.3%(+1.44)#7,275 |
| 13. | 75237 | 6.3% | 5.4%(+0.908)#518 | 5.3%(+0.974)#8,549 |
| 14. | 75231 | 6.0% | 5.4%(+0.633)#569 | 5.3%(+0.698)#9,398 |
| 15. | 75217 | 5.9% | 5.4%(+0.588)#579 | 5.3%(+0.653)#9,545 |
| 16. | 75234 | 5.8% | 5.4%(+0.441)#604 | 5.3%(+0.507)#10,054 |
| 17. | 75212 | 5.8% | 5.4%(+0.432)#606 | 5.3%(+0.497)#10,080 |
| 18. | 75203 | 5.7% | 5.4%(+0.312)#632 | 5.3%(+0.377)#10,477 |
| 19. | 75216 | 5.6% | 5.4%(+0.247)#648 | 5.3%(+0.313)#10,705 |
| 20. | 75243 | 5.6% | 5.4%(+0.222)#653 | 5.3%(+0.287)#10,790 |
| 21. | 75232 | 5.6% | 5.4%(+0.213)#657 | 5.3%(+0.278)#10,831 |
| 22. | 75249 | 5.5% | 5.4%(+0.104)#680 | 5.3%(+0.169)#11,201 |
| 23. | 75208 | 5.4% | 5.4%(+0.047)#697 | 5.3%(+0.112)#11,413 |
| 24. | 75229 | 5.1% | 5.4%(-0.212)#770 | 5.3%(-0.147)#12,401 |
| 25. | 75227 | 5.1% | 5.4%(-0.237)#776 | 5.3%(-0.172)#12,486 |
| 26. | 75223 | 5.1% | 5.4%(-0.260)#785 | 5.3%(-0.194)#12,575 |
| 27. | 75238 | 5.0% | 5.4%(-0.324)#803 | 5.3%(-0.259)#12,837 |
| 28. | 75215 | 5.0% | 5.4%(-0.347)#807 | 5.3%(-0.281)#12,931 |
| 29. | 75209 | 4.4% | 5.4%(-0.923)#935 | 5.3%(-0.858)#15,296 |
| 30. | 75248 | 4.4% | 5.4%(-0.960)#946 | 5.3%(-0.895)#15,455 |
| 31. | 75236 | 4.4% | 5.4%(-0.965)#947 | 5.3%(-0.900)#15,478 |
| 32. | 75287 | 4.3% | 5.4%(-1.06)#969 | 5.3%(-0.996)#15,925 |
| 33. | 75218 | 4.2% | 5.4%(-1.20)#1,005 | 5.3%(-1.13)#16,495 |
| 34. | 75219 | 3.8% | 5.4%(-1.58)#1,095 | 5.3%(-1.51)#18,027 |
| 35. | 75252 | 3.7% | 5.4%(-1.63)#1,105 | 5.3%(-1.56)#18,231 |
| 36. | 75204 | 3.6% | 5.4%(-1.72)#1,131 | 5.3%(-1.65)#18,639 |
| 37. | 75214 | 3.5% | 5.4%(-1.81)#1,145 | 5.3%(-1.74)#19,019 |
| 38. | 75206 | 3.4% | 5.4%(-1.95)#1,175 | 5.3%(-1.89)#19,632 |
| 39. | 75235 | 3.3% | 5.4%(-2.10)#1,208 | 5.3%(-2.04)#20,285 |
| 40. | 75244 | 3.1% | 5.4%(-2.28)#1,253 | 5.3%(-2.21)#20,966 |
| 41. | 75230 | 2.8% | 5.4%(-2.50)#1,296 | 5.3%(-2.44)#21,869 |
| 42. | 75201 | 2.7% | 5.4%(-2.67)#1,323 | 5.3%(-2.61)#22,497 |
| 43. | 75205 | 1.9% | 5.4%(-3.49)#1,461 | 5.3%(-3.43)#25,125 |
| 44. | 75226 | 1.6% | 5.4%(-3.74)#1,491 | 5.3%(-3.68)#25,740 |
| 45. | 75207 | 1.5% | 5.4%(-3.87)#1,514 | 5.3%(-3.80)#26,033 |
| 46. | 75202 | 1.1% | 5.4%(-4.21)#1,550 | 5.3%(-4.15)#26,724 |
| 47. | 75210 | 0.77% | 5.4%(-4.58)#1,574 | 5.3%(-4.52)#27,352 |
| 48. | 75225 | 0.59% | 5.4%(-4.76)#1,587 | 5.3%(-4.70)#27,589 |
1
Common Questions
What are the Top 10 Zip Codes with the Highest Percentage of Population Employed in Food Preparation & Serving in Dallas, TX?
Top 10 Zip Codes with the Highest Percentage of Population Employed in Food Preparation & Serving in Dallas, TX are:
What zip code has the Highest Percentage of Population Employed in Food Preparation & Serving in Dallas, TX?
75247 has the Highest Percentage of Population Employed in Food Preparation & Serving in Dallas, TX with 29.8%.
What is the Percentage of Population Employed in Food Preparation & Serving in Dallas, TX?
Percentage of Population Employed in Food Preparation & Serving in Dallas is 5.4%.
What is the Percentage of Population Employed in Food Preparation & Serving in Texas?
Percentage of Population Employed in Food Preparation & Serving in Texas is 5.4%.
What is the Percentage of Population Employed in Food Preparation & Serving in the United States?
Percentage of Population Employed in Food Preparation & Serving in the United States is 5.3%.