Zip Codes with the Highest Percentage of Population Employed in Transportation & Warehousing in Brownsville, TX
RELATED REPORTS & OPTIONS
Transportation & Warehousing
Brownsville
Compare Zip Codes
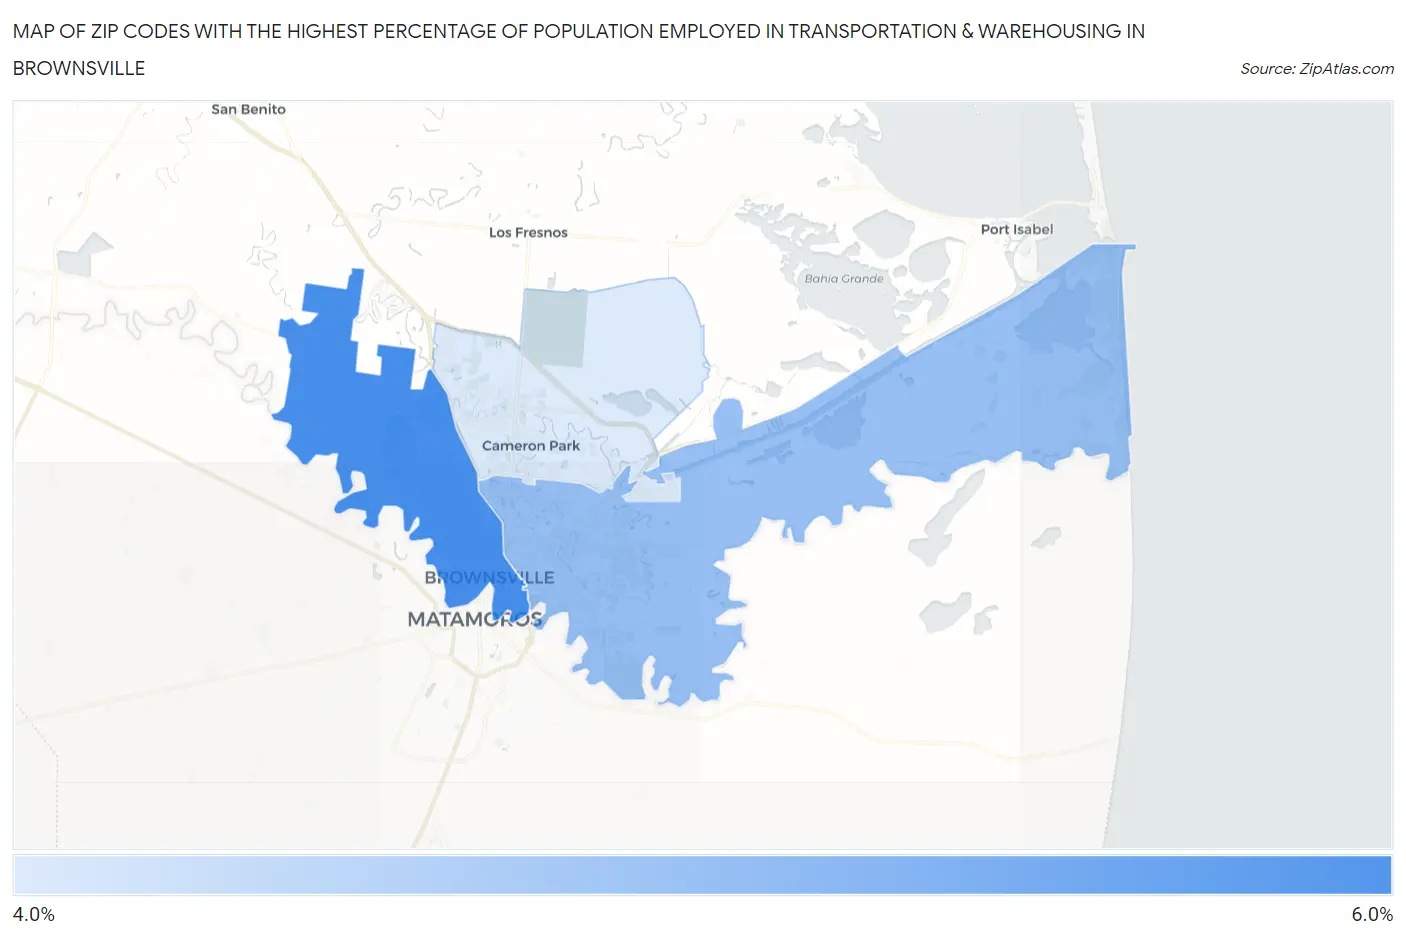
Map of Zip Codes with the Highest Percentage of Population Employed in Transportation & Warehousing in Brownsville
4.2%
5.5%
Zip Codes with the Highest Percentage of Population Employed in Transportation & Warehousing in Brownsville, TX
| Zip Code | % Employed | vs State | vs National | |
| 1. | 78520 | 5.5% | 5.5%(+0.023)#720 | 4.9%(+0.578)#10,176 |
| 2. | 78521 | 4.8% | 5.5%(-0.707)#870 | 4.9%(-0.151)#12,663 |
| 3. | 78526 | 4.2% | 5.5%(-1.32)#1,000 | 4.9%(-0.767)#15,107 |
1
Common Questions
What are the Top Zip Codes with the Highest Percentage of Population Employed in Transportation & Warehousing in Brownsville, TX?
Top Zip Codes with the Highest Percentage of Population Employed in Transportation & Warehousing in Brownsville, TX are:
What zip code has the Highest Percentage of Population Employed in Transportation & Warehousing in Brownsville, TX?
78520 has the Highest Percentage of Population Employed in Transportation & Warehousing in Brownsville, TX with 5.5%.
What is the Percentage of Population Employed in Transportation & Warehousing in Brownsville, TX?
Percentage of Population Employed in Transportation & Warehousing in Brownsville is 4.8%.
What is the Percentage of Population Employed in Transportation & Warehousing in Texas?
Percentage of Population Employed in Transportation & Warehousing in Texas is 5.5%.
What is the Percentage of Population Employed in Transportation & Warehousing in the United States?
Percentage of Population Employed in Transportation & Warehousing in the United States is 4.9%.