Zip Codes with the Highest Percentage of Households with Income Above $100,000 in Brownsville, TX
RELATED REPORTS & OPTIONS
Household Income | $100k+
Brownsville
Compare Zip Codes
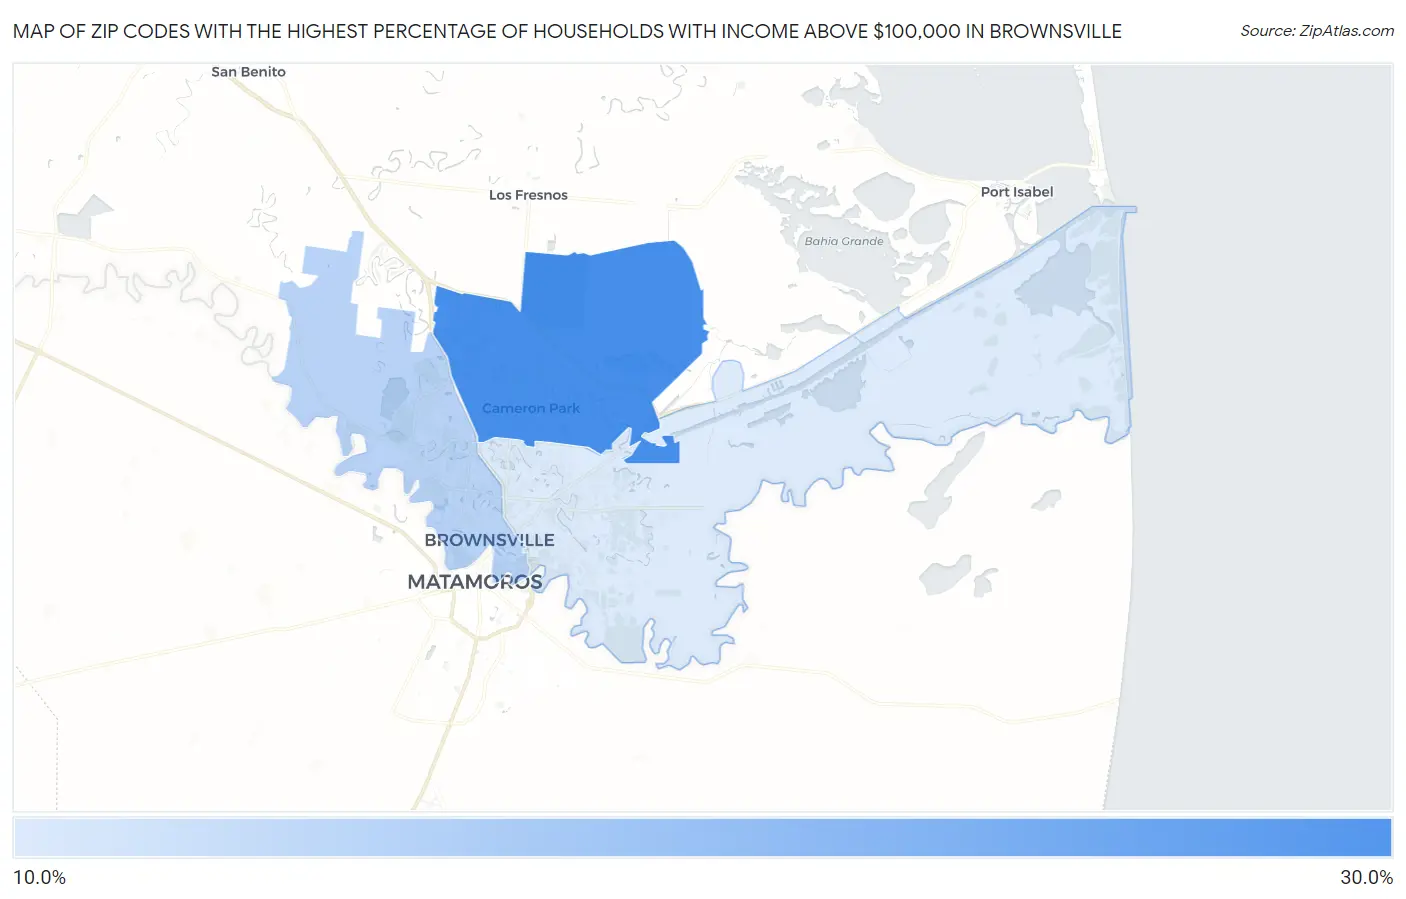
Map of Zip Codes with the Highest Percentage of Households with Income Above $100,000 in Brownsville
12.6%
29.4%
Zip Codes with the Highest Percentage of Households with Income Above $100,000 in Brownsville, TX
| Zip Code | Households with Income > $100k | vs State | vs National | |
| 1. | 78526 | 29.4% | 36.2%(-6.80)#894 | 37.3%(-7.90)#15,901 |
| 2. | 78520 | 16.6% | 36.2%(-19.6)#1,553 | 37.3%(-20.7)#26,494 |
| 3. | 78521 | 12.6% | 36.2%(-23.6)#1,686 | 37.3%(-24.7)#28,758 |
1
Common Questions
What are the Top Zip Codes with the Highest Percentage of Households with Income Above $100,000 in Brownsville, TX?
Top Zip Codes with the Highest Percentage of Households with Income Above $100,000 in Brownsville, TX are:
What zip code has the Highest Percentage of Households with Income Above $100,000 in Brownsville, TX?
78526 has the Highest Percentage of Households with Income Above $100,000 in Brownsville, TX with 29.4%.
What is the Percentage of Households with Income Above $100,000 in Brownsville, TX?
Percentage of Households with Income Above $100,000 in Brownsville is 18.5%.
What is the Percentage of Households with Income Above $100,000 in Texas?
Percentage of Households with Income Above $100,000 in Texas is 36.2%.
What is the Percentage of Households with Income Above $100,000 in the United States?
Percentage of Households with Income Above $100,000 in the United States is 37.3%.