Zip Codes with the Highest Percentage of Population Employed in Computer, Engineering & Science in Brownsville, TX
RELATED REPORTS & OPTIONS
Computer, Engineering & Science
Brownsville
Compare Zip Codes
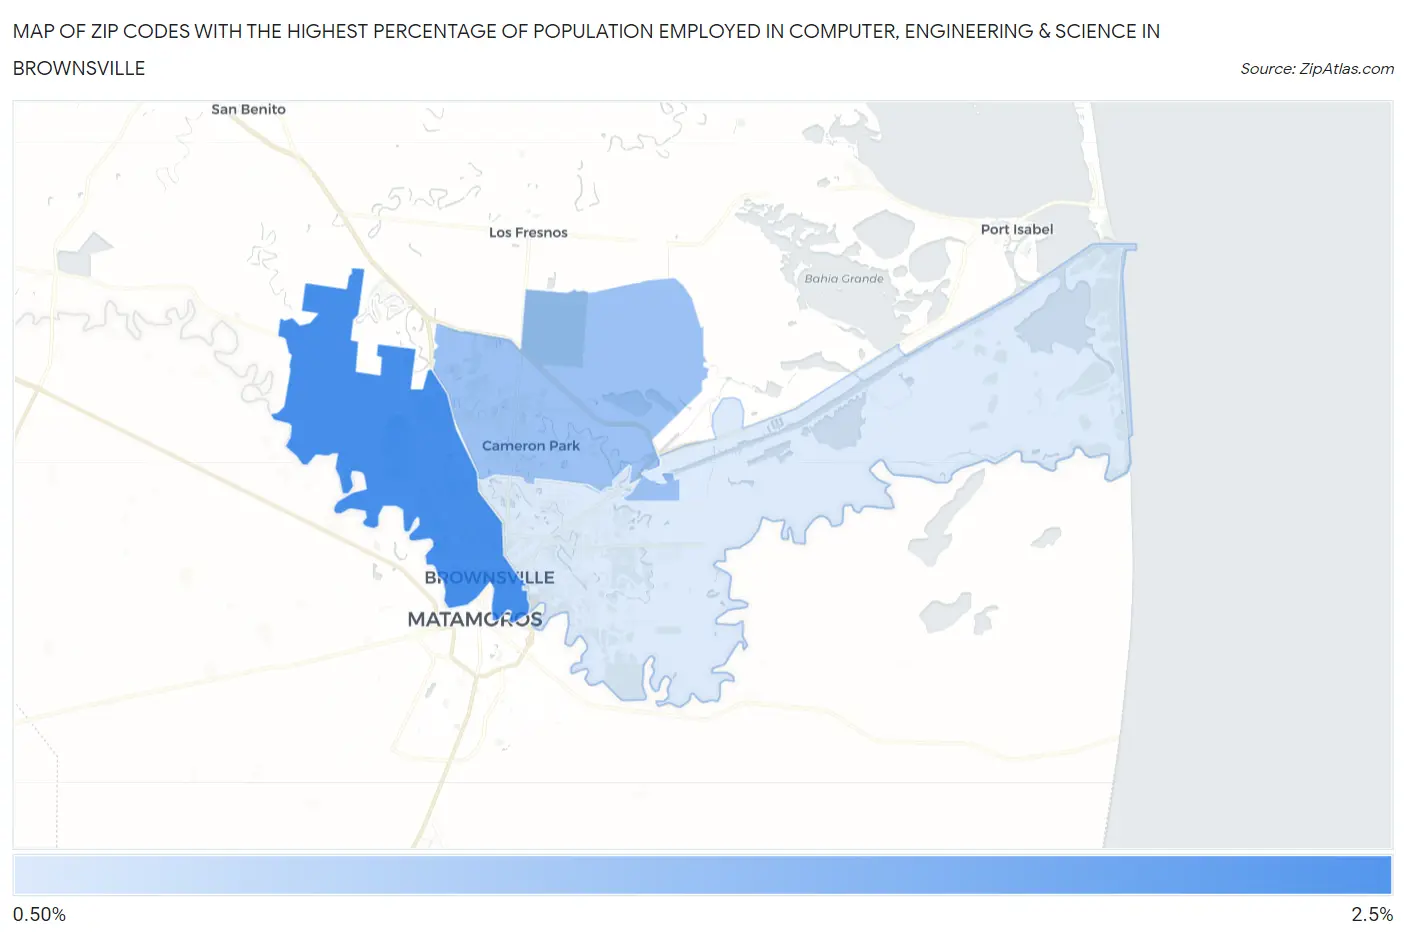
Map of Zip Codes with the Highest Percentage of Population Employed in Computer, Engineering & Science in Brownsville
1.4%
2.2%
Zip Codes with the Highest Percentage of Population Employed in Computer, Engineering & Science in Brownsville, TX
| Zip Code | % Employed | vs State | vs National | |
| 1. | 78520 | 2.2% | 6.5%(-4.32)#1,127 | 6.8%(-4.58)#21,161 |
| 2. | 78526 | 1.7% | 6.5%(-4.78)#1,248 | 6.8%(-5.04)#22,848 |
| 3. | 78521 | 1.4% | 6.5%(-5.12)#1,322 | 6.8%(-5.39)#23,977 |
1
Common Questions
What are the Top Zip Codes with the Highest Percentage of Population Employed in Computer, Engineering & Science in Brownsville, TX?
Top Zip Codes with the Highest Percentage of Population Employed in Computer, Engineering & Science in Brownsville, TX are:
What zip code has the Highest Percentage of Population Employed in Computer, Engineering & Science in Brownsville, TX?
78520 has the Highest Percentage of Population Employed in Computer, Engineering & Science in Brownsville, TX with 2.2%.
What is the Percentage of Population Employed in Computer, Engineering & Science in Brownsville, TX?
Percentage of Population Employed in Computer, Engineering & Science in Brownsville is 1.8%.
What is the Percentage of Population Employed in Computer, Engineering & Science in Texas?
Percentage of Population Employed in Computer, Engineering & Science in Texas is 6.5%.
What is the Percentage of Population Employed in Computer, Engineering & Science in the United States?
Percentage of Population Employed in Computer, Engineering & Science in the United States is 6.8%.