Zip Codes with the Highest Percentage of Population Employed in Food Preparation & Serving in Pasadena, TX
RELATED REPORTS & OPTIONS
Food Preparation & Serving
Pasadena
Compare Zip Codes
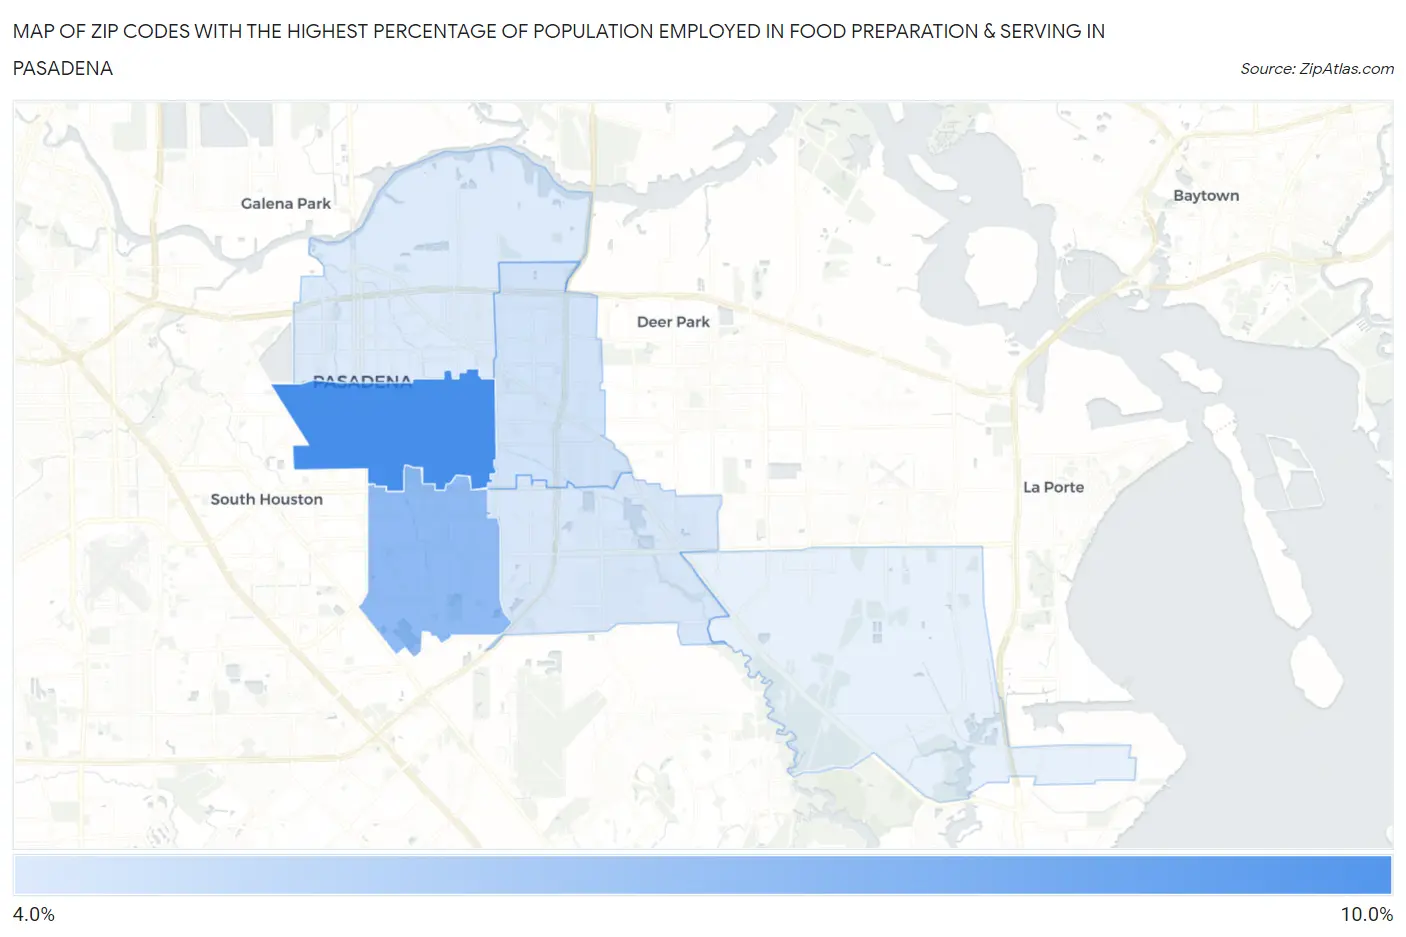
Map of Zip Codes with the Highest Percentage of Population Employed in Food Preparation & Serving in Pasadena
4.2%
8.8%
Zip Codes with the Highest Percentage of Population Employed in Food Preparation & Serving in Pasadena, TX
| Zip Code | % Employed | vs State | vs National | |
| 1. | 77502 | 8.8% | 5.4%(+3.42)#218 | 5.3%(+3.49)#3,758 |
| 2. | 77504 | 6.6% | 5.4%(+1.25)#470 | 5.3%(+1.32)#7,588 |
| 3. | 77503 | 4.6% | 5.4%(-0.796)#917 | 5.3%(-0.731)#14,808 |
| 4. | 77505 | 4.4% | 5.4%(-0.971)#948 | 5.3%(-0.906)#15,505 |
| 5. | 77506 | 4.2% | 5.4%(-1.14)#990 | 5.3%(-1.07)#16,274 |
1
Common Questions
What are the Top 5 Zip Codes with the Highest Percentage of Population Employed in Food Preparation & Serving in Pasadena, TX?
Top 5 Zip Codes with the Highest Percentage of Population Employed in Food Preparation & Serving in Pasadena, TX are:
What zip code has the Highest Percentage of Population Employed in Food Preparation & Serving in Pasadena, TX?
77502 has the Highest Percentage of Population Employed in Food Preparation & Serving in Pasadena, TX with 8.8%.
What is the Percentage of Population Employed in Food Preparation & Serving in Pasadena, TX?
Percentage of Population Employed in Food Preparation & Serving in Pasadena is 5.6%.
What is the Percentage of Population Employed in Food Preparation & Serving in Texas?
Percentage of Population Employed in Food Preparation & Serving in Texas is 5.4%.
What is the Percentage of Population Employed in Food Preparation & Serving in the United States?
Percentage of Population Employed in Food Preparation & Serving in the United States is 5.3%.