Zip Codes with the Highest Percentage of Population Employed in Food Preparation & Serving in Santa Fe, TX
RELATED REPORTS & OPTIONS
Food Preparation & Serving
Santa Fe
Compare Zip Codes
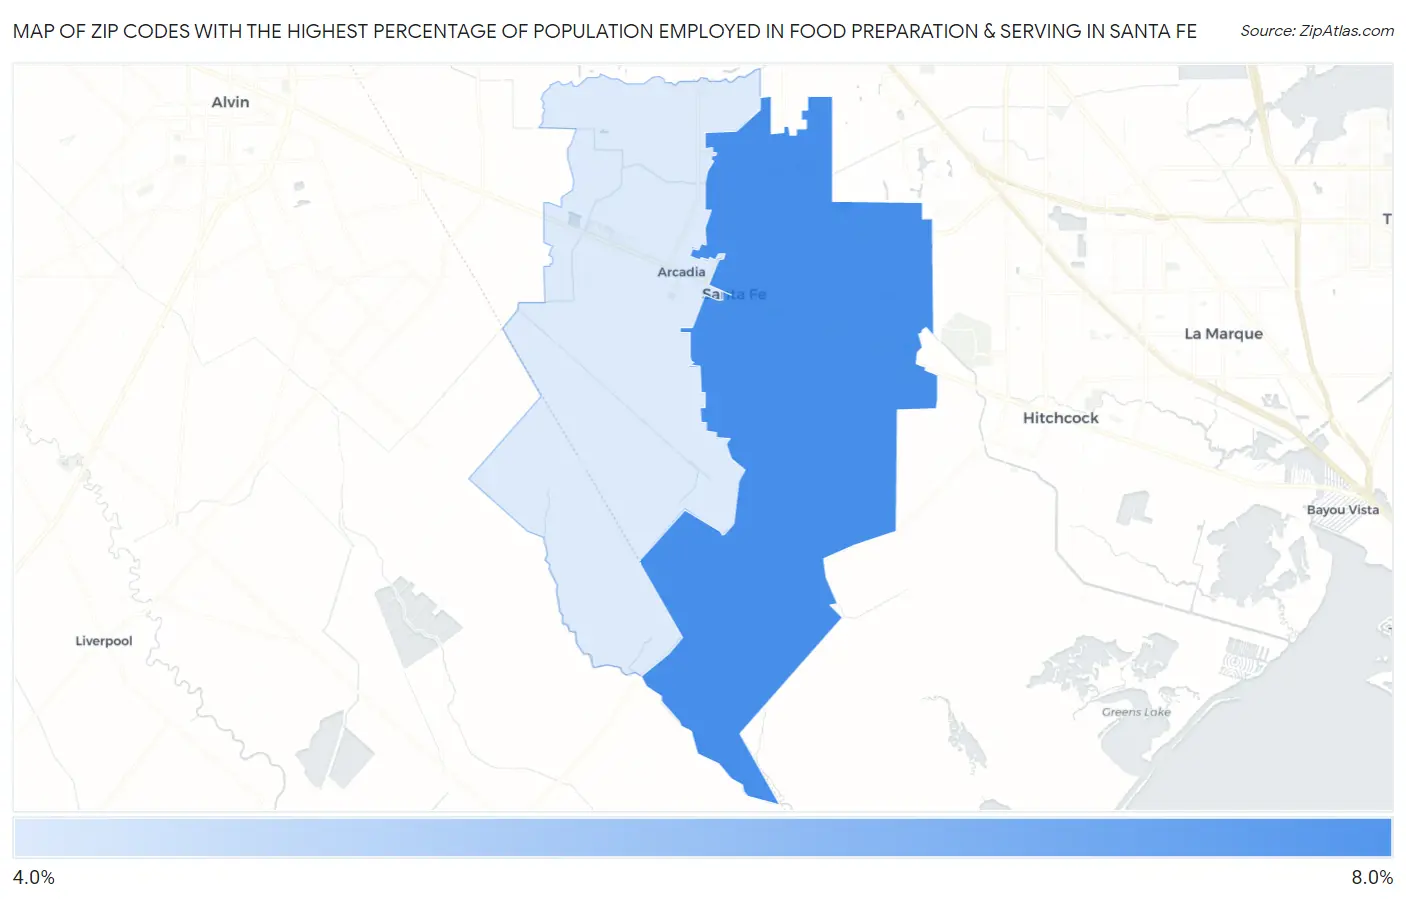
Map of Zip Codes with the Highest Percentage of Population Employed in Food Preparation & Serving in Santa Fe
4.2%
7.1%
Zip Codes with the Highest Percentage of Population Employed in Food Preparation & Serving in Santa Fe, TX
| Zip Code | % Employed | vs State | vs National | |
| 1. | 77510 | 7.1% | 5.4%(+1.72)#402 | 5.3%(+1.78)#6,404 |
| 2. | 77517 | 4.2% | 5.4%(-1.20)#1,003 | 5.3%(-1.13)#16,489 |
1
Common Questions
What are the Top Zip Codes with the Highest Percentage of Population Employed in Food Preparation & Serving in Santa Fe, TX?
Top Zip Codes with the Highest Percentage of Population Employed in Food Preparation & Serving in Santa Fe, TX are:
What zip code has the Highest Percentage of Population Employed in Food Preparation & Serving in Santa Fe, TX?
77510 has the Highest Percentage of Population Employed in Food Preparation & Serving in Santa Fe, TX with 7.1%.
What is the Percentage of Population Employed in Food Preparation & Serving in Santa Fe, TX?
Percentage of Population Employed in Food Preparation & Serving in Santa Fe is 6.4%.
What is the Percentage of Population Employed in Food Preparation & Serving in Texas?
Percentage of Population Employed in Food Preparation & Serving in Texas is 5.4%.
What is the Percentage of Population Employed in Food Preparation & Serving in the United States?
Percentage of Population Employed in Food Preparation & Serving in the United States is 5.3%.