Zip Codes with the Highest Percentage of Households with Income Above $100,000 in Beaumont, TX
RELATED REPORTS & OPTIONS
Household Income | $100k+
Beaumont
Compare Zip Codes
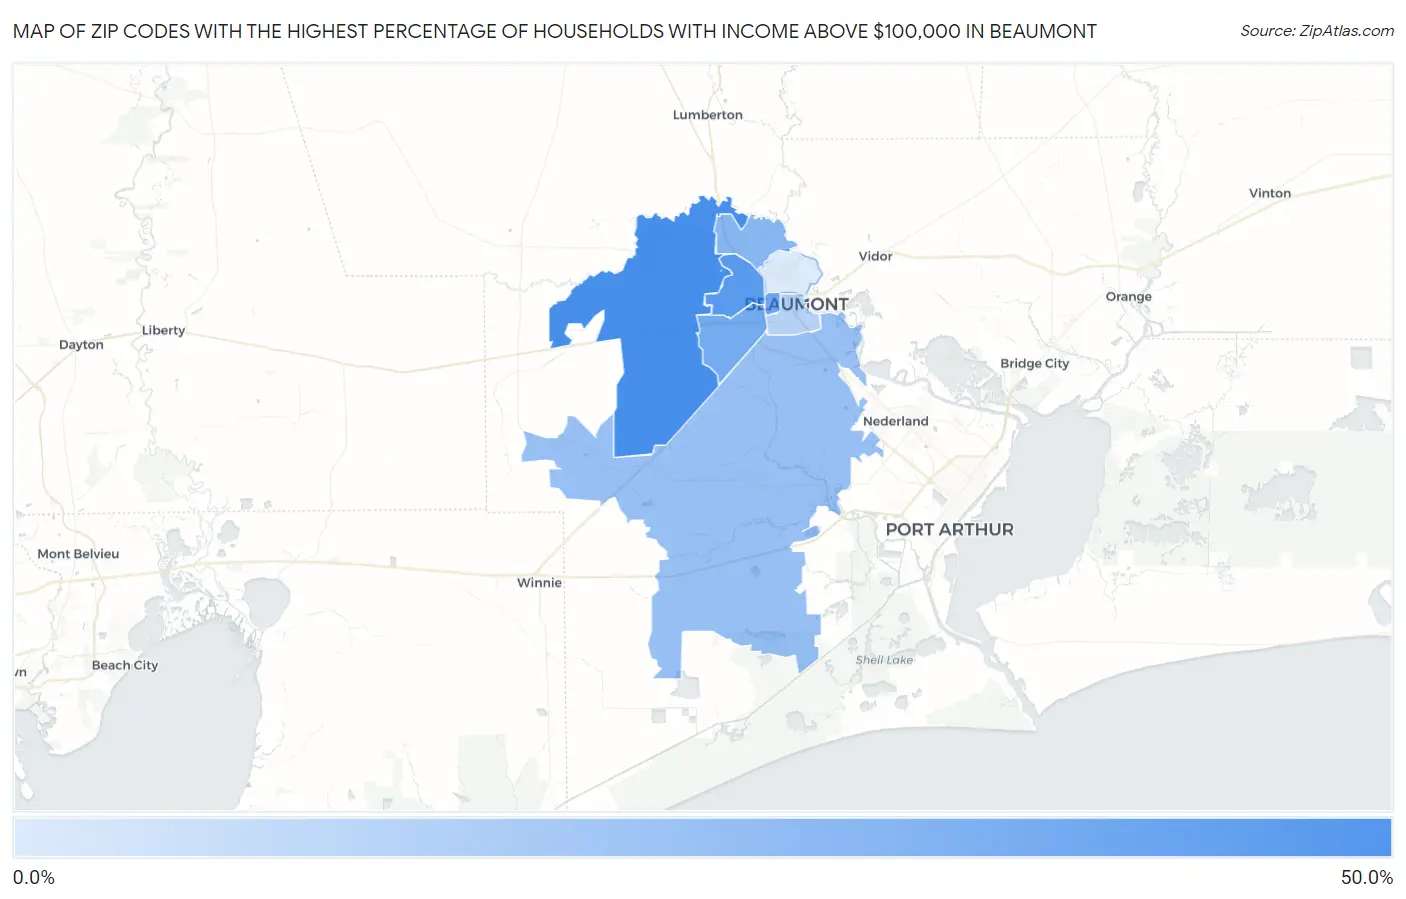
Map of Zip Codes with the Highest Percentage of Households with Income Above $100,000 in Beaumont
6.3%
40.7%
Zip Codes with the Highest Percentage of Households with Income Above $100,000 in Beaumont, TX
| Zip Code | Households with Income > $100k | vs State | vs National | |
| 1. | 77713 | 40.7% | 36.2%(+4.50)#465 | 37.3%(+3.40)#8,556 |
| 2. | 77706 | 36.6% | 36.2%(+0.400)#603 | 37.3%(-0.700)#10,810 |
| 3. | 77702 | 31.3% | 36.2%(-4.90)#809 | 37.3%(-6.00)#14,410 |
| 4. | 77707 | 29.2% | 36.2%(-7.00)#902 | 37.3%(-8.10)#16,068 |
| 5. | 77708 | 24.5% | 36.2%(-11.7)#1,146 | 37.3%(-12.8)#20,197 |
| 6. | 77705 | 21.0% | 36.2%(-15.2)#1,357 | 37.3%(-16.3)#23,228 |
| 7. | 77701 | 14.4% | 36.2%(-21.8)#1,639 | 37.3%(-22.9)#27,888 |
| 8. | 77703 | 6.3% | 36.2%(-29.9)#1,796 | 37.3%(-31.0)#30,800 |
1
Common Questions
What are the Top 5 Zip Codes with the Highest Percentage of Households with Income Above $100,000 in Beaumont, TX?
Top 5 Zip Codes with the Highest Percentage of Households with Income Above $100,000 in Beaumont, TX are:
What zip code has the Highest Percentage of Households with Income Above $100,000 in Beaumont, TX?
77713 has the Highest Percentage of Households with Income Above $100,000 in Beaumont, TX with 40.7%.
What is the Percentage of Households with Income Above $100,000 in Beaumont, TX?
Percentage of Households with Income Above $100,000 in Beaumont is 24.6%.
What is the Percentage of Households with Income Above $100,000 in Texas?
Percentage of Households with Income Above $100,000 in Texas is 36.2%.
What is the Percentage of Households with Income Above $100,000 in the United States?
Percentage of Households with Income Above $100,000 in the United States is 37.3%.