Zip Codes with the Highest Percentage of Households with Income Above $200,000 in Orangeburg, SC
RELATED REPORTS & OPTIONS
Household Income | $200k+
Orangeburg
Compare Zip Codes
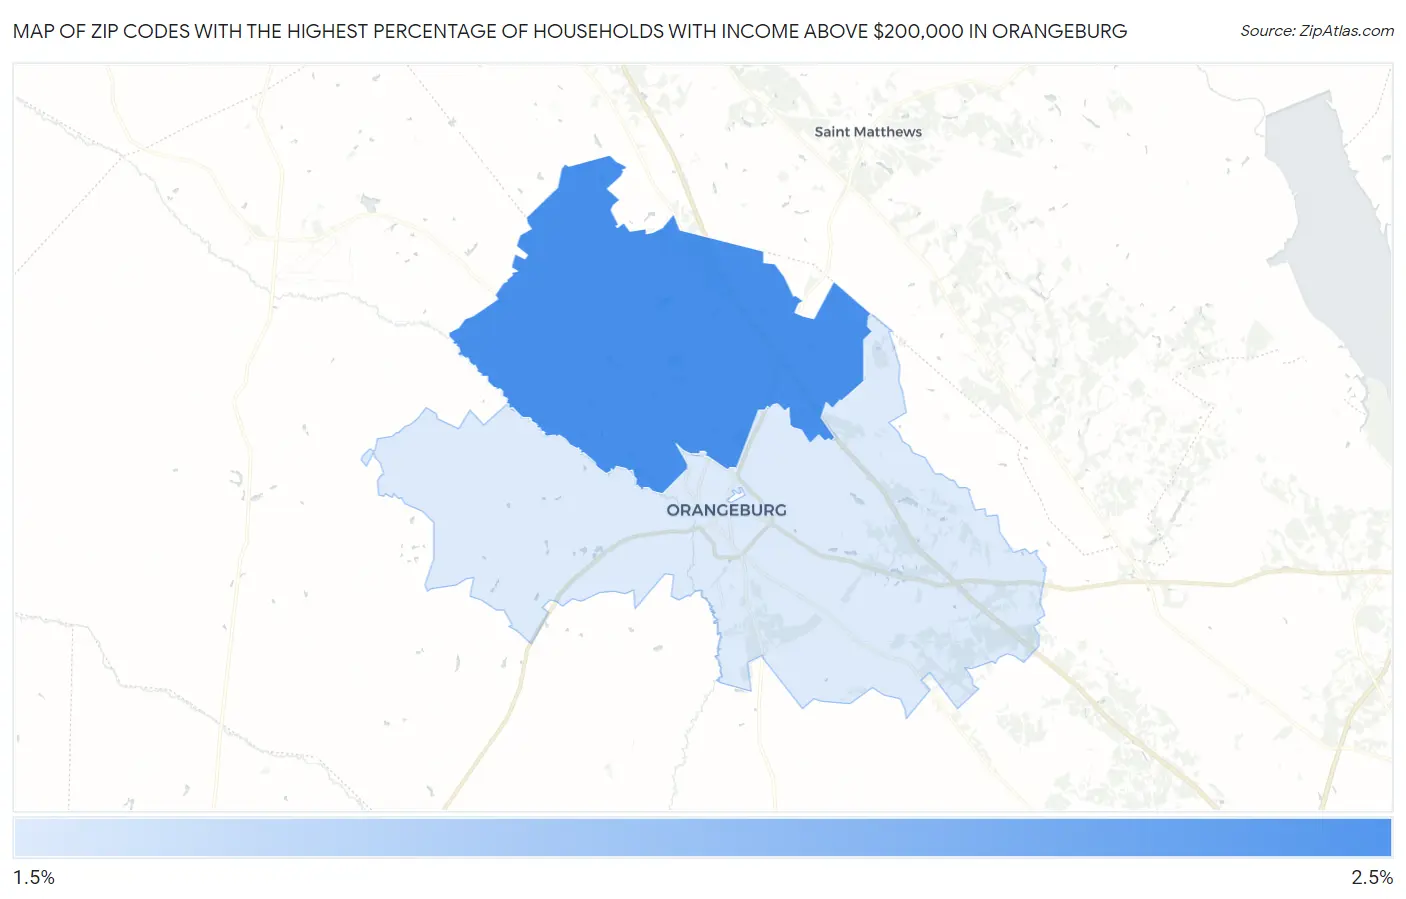
Map of Zip Codes with the Highest Percentage of Households with Income Above $200,000 in Orangeburg
1.8%
2.2%
Zip Codes with the Highest Percentage of Households with Income Above $200,000 in Orangeburg, SC
| Zip Code | Households with Income > $200k | vs State | vs National | |
| 1. | 29118 | 2.2% | 7.4%(-5.20)#265 | 11.4%(-9.20)#23,201 |
| 2. | 29115 | 1.8% | 7.4%(-5.60)#289 | 11.4%(-9.60)#24,298 |
1
Common Questions
What are the Top Zip Codes with the Highest Percentage of Households with Income Above $200,000 in Orangeburg, SC?
Top Zip Codes with the Highest Percentage of Households with Income Above $200,000 in Orangeburg, SC are:
What zip code has the Highest Percentage of Households with Income Above $200,000 in Orangeburg, SC?
29118 has the Highest Percentage of Households with Income Above $200,000 in Orangeburg, SC with 2.2%.
What is the Percentage of Households with Income Above $200,000 in Orangeburg, SC?
Percentage of Households with Income Above $200,000 in Orangeburg is 1.7%.
What is the Percentage of Households with Income Above $200,000 in South Carolina?
Percentage of Households with Income Above $200,000 in South Carolina is 7.4%.
What is the Percentage of Households with Income Above $200,000 in the United States?
Percentage of Households with Income Above $200,000 in the United States is 11.4%.