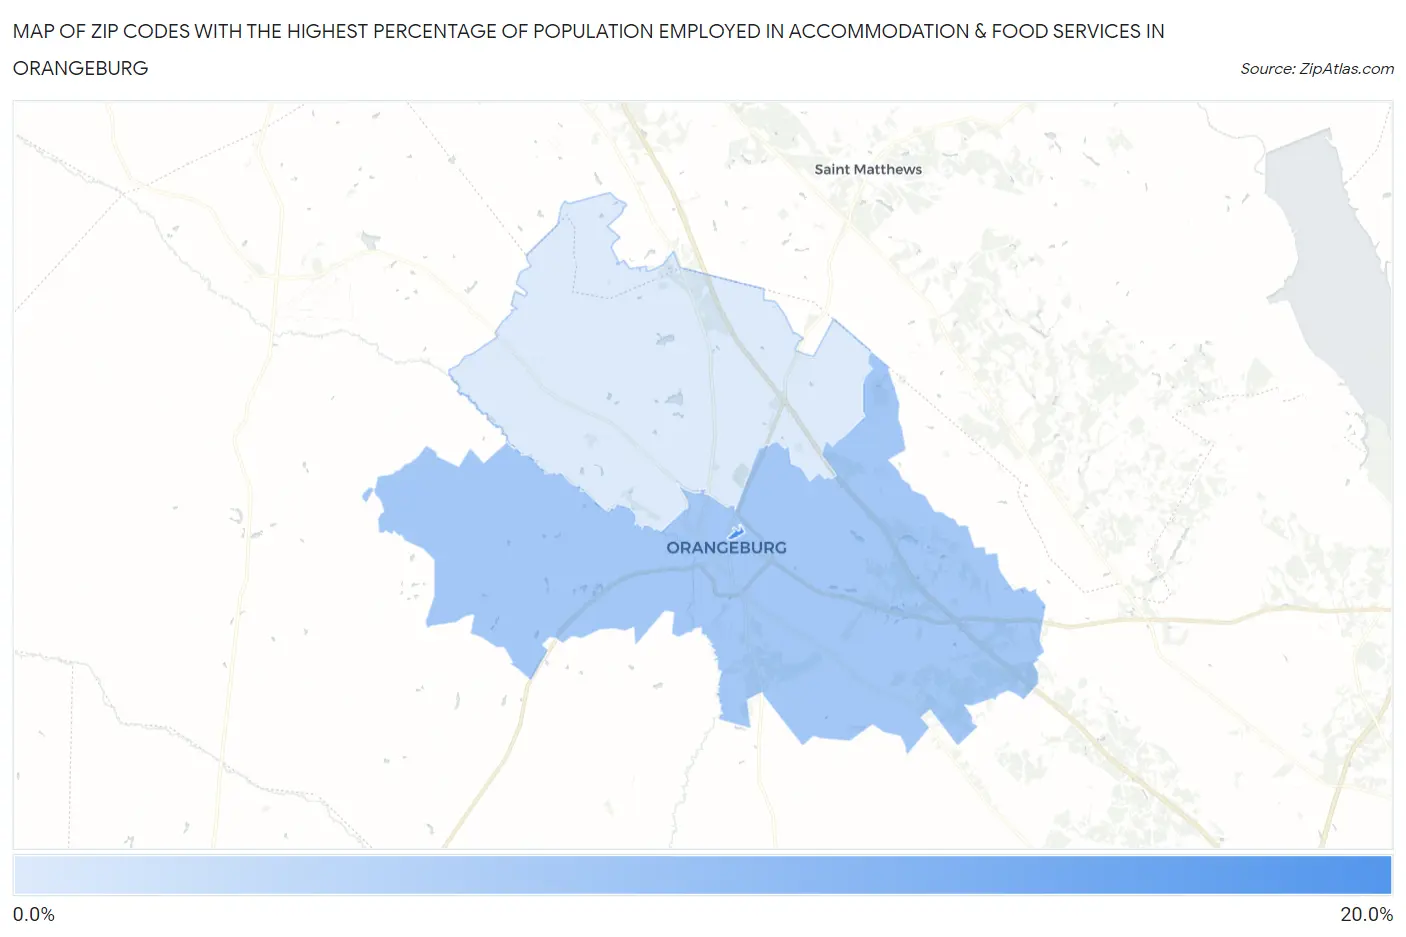
Zip Codes with the Highest Percentage of Population Employed in Accommodation & Food Services in Orangeburg, SC
RELATED REPORTS & OPTIONS
Accommodation & Food Services
Orangeburg
Compare Zip Codes
Map of Zip Codes with the Highest Percentage of Population Employed in Accommodation & Food Services in Orangeburg
4.8%
18.3%
Zip Codes with the Highest Percentage of Population Employed in Accommodation & Food Services in Orangeburg, SC
| Zip Code | % Employed | vs State | vs National | |
| 1. | 29117 | 18.3% | 8.0%(+10.3)#20 | 6.9%(+11.4)#1,047 |
| 2. | 29115 | 9.8% | 8.0%(+1.83)#94 | 6.9%(+2.92)#4,789 |
| 3. | 29118 | 4.8% | 8.0%(-3.17)#285 | 6.9%(-2.08)#17,493 |
1
Common Questions
What are the Top Zip Codes with the Highest Percentage of Population Employed in Accommodation & Food Services in Orangeburg, SC?
Top Zip Codes with the Highest Percentage of Population Employed in Accommodation & Food Services in Orangeburg, SC are:
What zip code has the Highest Percentage of Population Employed in Accommodation & Food Services in Orangeburg, SC?
29117 has the Highest Percentage of Population Employed in Accommodation & Food Services in Orangeburg, SC with 18.3%.
What is the Percentage of Population Employed in Accommodation & Food Services in Orangeburg, SC?
Percentage of Population Employed in Accommodation & Food Services in Orangeburg is 9.9%.
What is the Percentage of Population Employed in Accommodation & Food Services in South Carolina?
Percentage of Population Employed in Accommodation & Food Services in South Carolina is 8.0%.
What is the Percentage of Population Employed in Accommodation & Food Services in the United States?
Percentage of Population Employed in Accommodation & Food Services in the United States is 6.9%.