Zip Codes with the Highest Percentage of Households with Income Above $200,000 in Conway, SC
RELATED REPORTS & OPTIONS
Household Income | $200k+
Conway
Compare Zip Codes
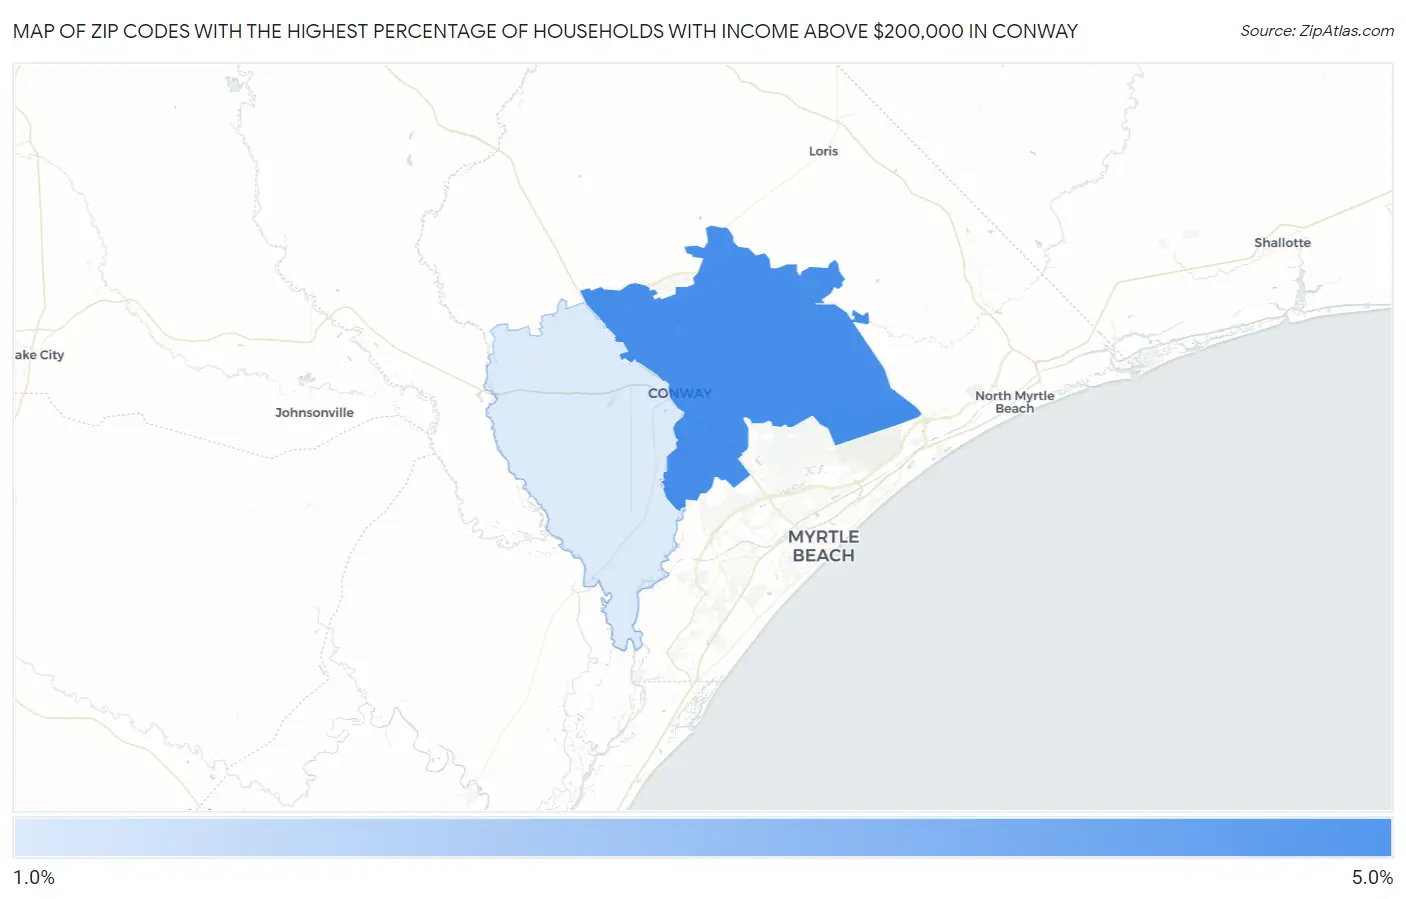
Map of Zip Codes with the Highest Percentage of Households with Income Above $200,000 in Conway
1.5%
4.2%
Zip Codes with the Highest Percentage of Households with Income Above $200,000 in Conway, SC
| Zip Code | Households with Income > $200k | vs State | vs National | |
| 1. | 29526 | 4.2% | 7.4%(-3.20)#184 | 11.4%(-7.20)#17,530 |
| 2. | 29527 | 1.5% | 7.4%(-5.90)#302 | 11.4%(-9.90)#25,052 |
1
Common Questions
What are the Top Zip Codes with the Highest Percentage of Households with Income Above $200,000 in Conway, SC?
Top Zip Codes with the Highest Percentage of Households with Income Above $200,000 in Conway, SC are:
What zip code has the Highest Percentage of Households with Income Above $200,000 in Conway, SC?
29526 has the Highest Percentage of Households with Income Above $200,000 in Conway, SC with 4.2%.
What is the Percentage of Households with Income Above $200,000 in Conway, SC?
Percentage of Households with Income Above $200,000 in Conway is 3.5%.
What is the Percentage of Households with Income Above $200,000 in South Carolina?
Percentage of Households with Income Above $200,000 in South Carolina is 7.4%.
What is the Percentage of Households with Income Above $200,000 in the United States?
Percentage of Households with Income Above $200,000 in the United States is 11.4%.