Zip Codes with the Highest Percentage of Population with a Degree in Visual and Performing Arts in Orangeburg, SC
RELATED REPORTS & OPTIONS
Visual and Performing Arts
Orangeburg
Compare Zip Codes
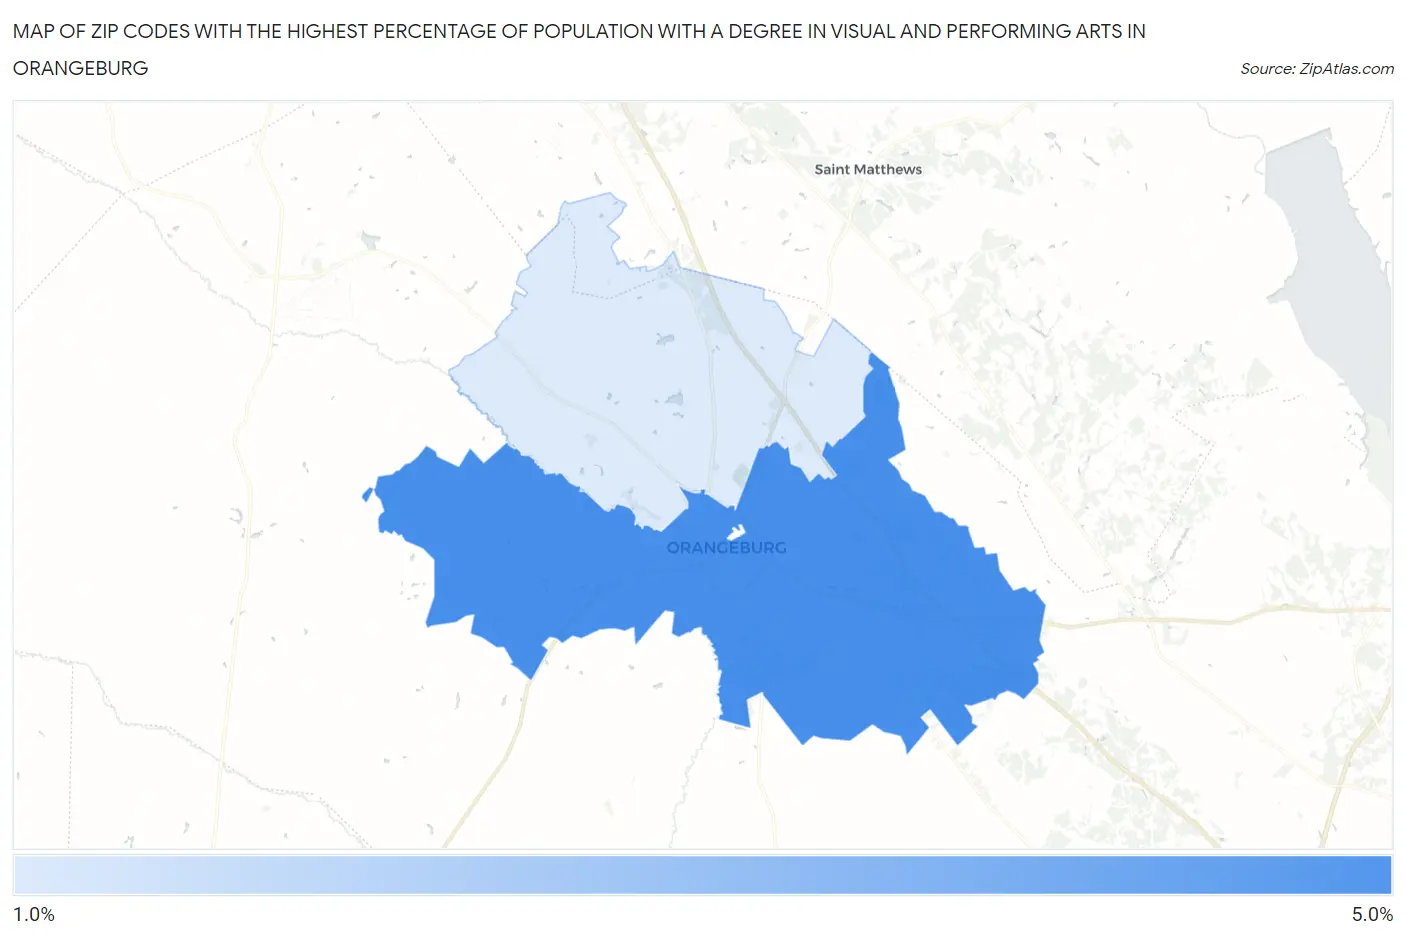
Map of Zip Codes with the Highest Percentage of Population with a Degree in Visual and Performing Arts in Orangeburg
1.1%
4.7%
Zip Codes with the Highest Percentage of Population with a Degree in Visual and Performing Arts in Orangeburg, SC
| Zip Code | % Graduates | vs State | vs National | |
| 1. | 29115 | 4.7% | 3.3%(+1.46)#66 | 4.3%(+0.467)#7,260 |
| 2. | 29118 | 1.1% | 3.3%(-2.13)#250 | 4.3%(-3.12)#19,281 |
1
Common Questions
What are the Top Zip Codes with the Highest Percentage of Population with a Degree in Visual and Performing Arts in Orangeburg, SC?
Top Zip Codes with the Highest Percentage of Population with a Degree in Visual and Performing Arts in Orangeburg, SC are:
What zip code has the Highest Percentage of Population with a Degree in Visual and Performing Arts in Orangeburg, SC?
29115 has the Highest Percentage of Population with a Degree in Visual and Performing Arts in Orangeburg, SC with 4.7%.
What is the Percentage of Population with a Degree in Visual and Performing Arts in Orangeburg, SC?
Percentage of Population with a Degree in Visual and Performing Arts in Orangeburg is 6.4%.
What is the Percentage of Population with a Degree in Visual and Performing Arts in South Carolina?
Percentage of Population with a Degree in Visual and Performing Arts in South Carolina is 3.3%.
What is the Percentage of Population with a Degree in Visual and Performing Arts in the United States?
Percentage of Population with a Degree in Visual and Performing Arts in the United States is 4.3%.