Zip Codes with the Highest Percentage of Households with Income Above $100,000 in Orangeburg, SC
RELATED REPORTS & OPTIONS
Household Income | $100k+
Orangeburg
Compare Zip Codes
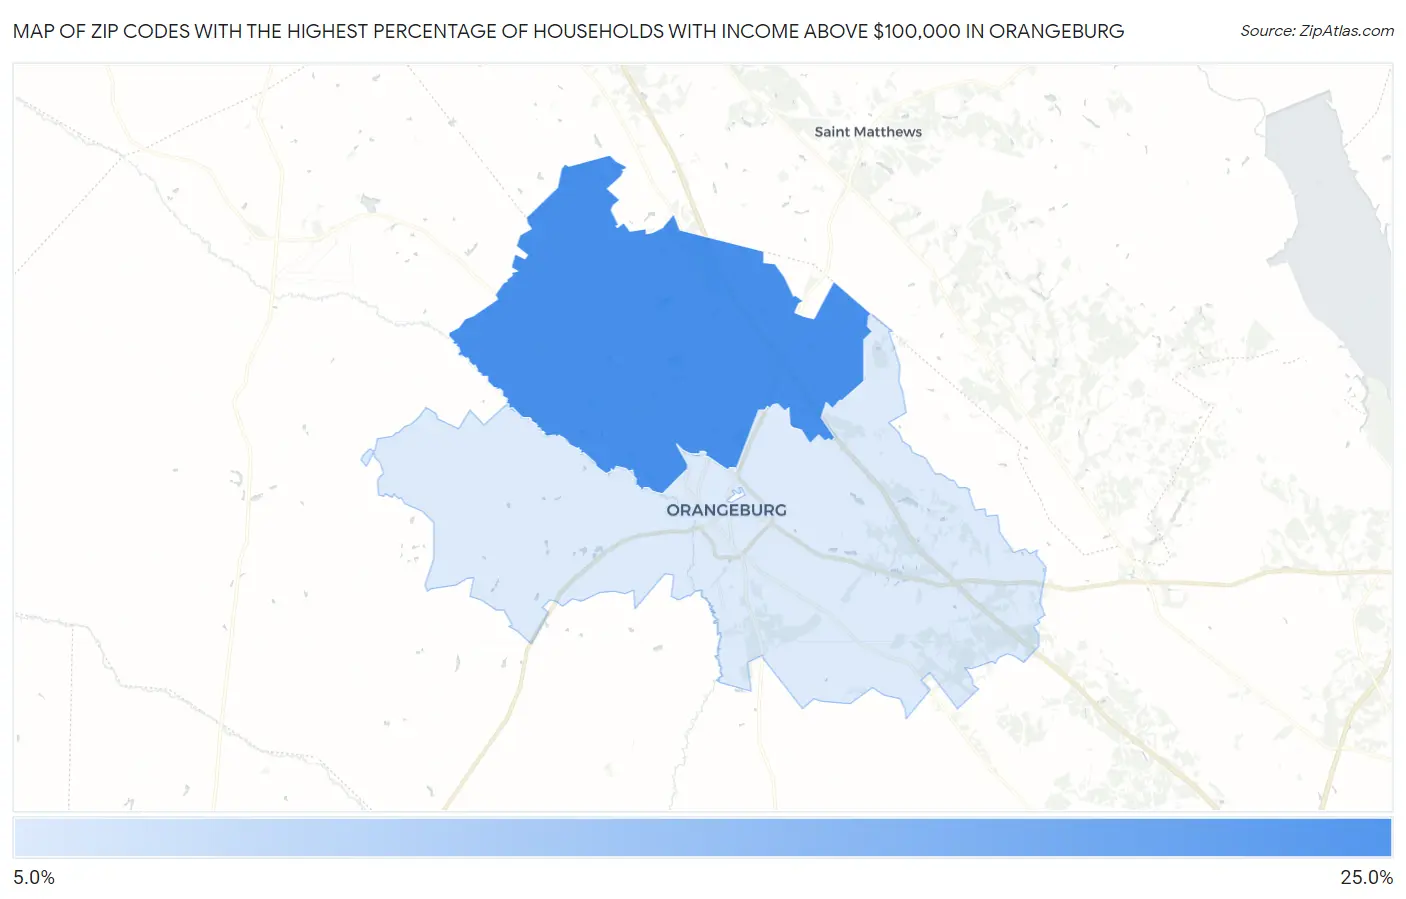
Map of Zip Codes with the Highest Percentage of Households with Income Above $100,000 in Orangeburg
11.1%
23.2%
Zip Codes with the Highest Percentage of Households with Income Above $100,000 in Orangeburg, SC
| Zip Code | Households with Income > $100k | vs State | vs National | |
| 1. | 29118 | 23.2% | 29.7%(-6.50)#192 | 37.3%(-14.1)#21,410 |
| 2. | 29115 | 11.1% | 29.7%(-18.6)#350 | 37.3%(-26.2)#29,393 |
1
Common Questions
What are the Top Zip Codes with the Highest Percentage of Households with Income Above $100,000 in Orangeburg, SC?
Top Zip Codes with the Highest Percentage of Households with Income Above $100,000 in Orangeburg, SC are:
What zip code has the Highest Percentage of Households with Income Above $100,000 in Orangeburg, SC?
29118 has the Highest Percentage of Households with Income Above $100,000 in Orangeburg, SC with 23.2%.
What is the Percentage of Households with Income Above $100,000 in Orangeburg, SC?
Percentage of Households with Income Above $100,000 in Orangeburg is 13.1%.
What is the Percentage of Households with Income Above $100,000 in South Carolina?
Percentage of Households with Income Above $100,000 in South Carolina is 29.7%.
What is the Percentage of Households with Income Above $100,000 in the United States?
Percentage of Households with Income Above $100,000 in the United States is 37.3%.