Zip Codes with the Highest Percentage of Households Without a Vehicle in Orangeburg, SC
RELATED REPORTS & OPTIONS
Households without a Cars
Orangeburg
Compare Zip Codes
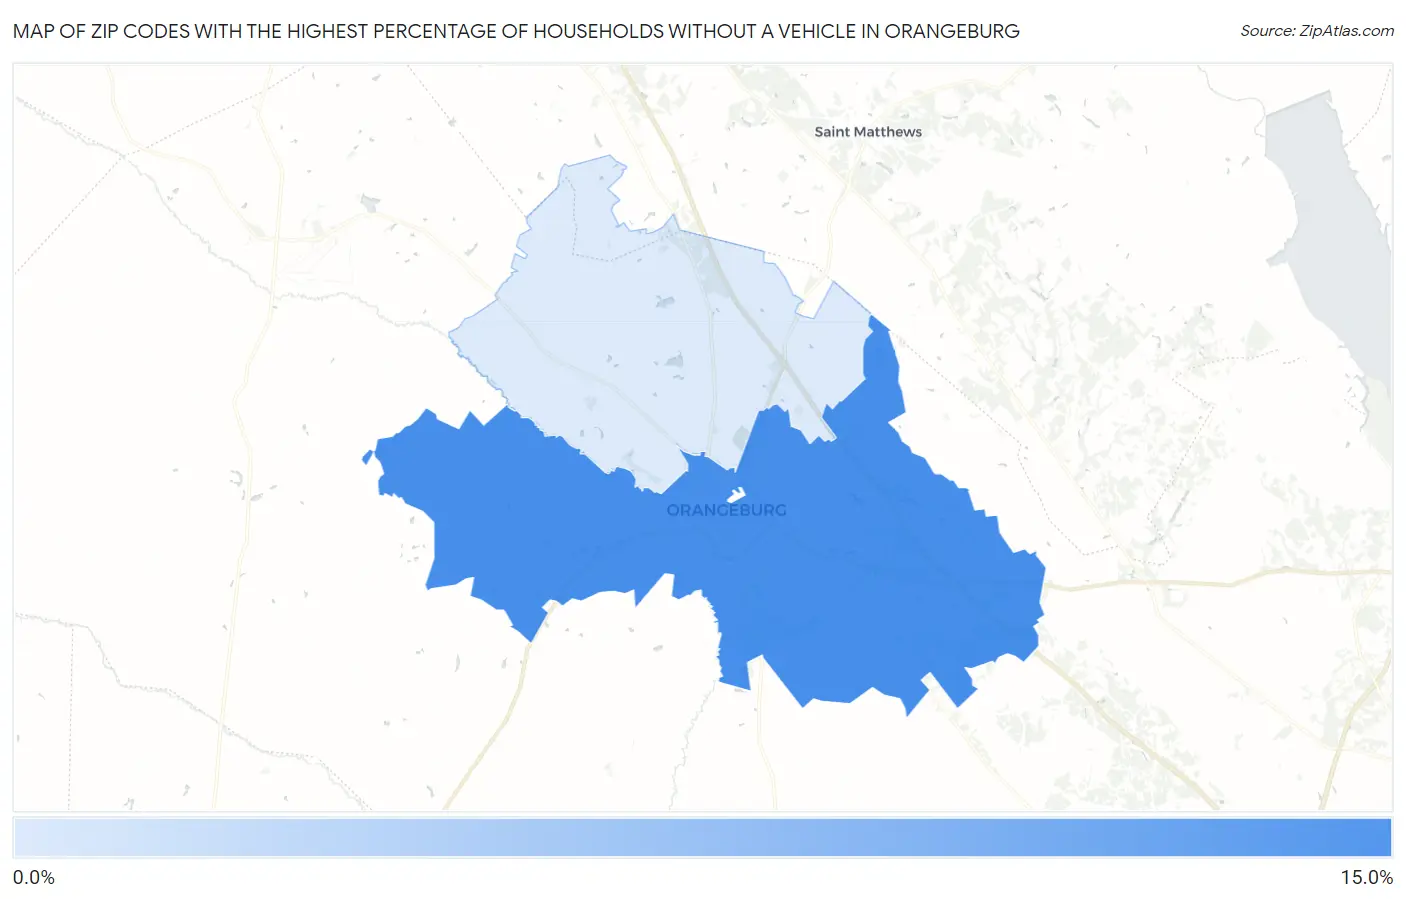
Map of Zip Codes with the Highest Percentage of Households Without a Vehicle in Orangeburg
4.3%
11.3%
Zip Codes with the Highest Percentage of Households Without a Vehicle in Orangeburg, SC
| Zip Code | Housholds Without a Car | vs State | vs National | |
| 1. | 29115 | 11.3% | 5.7%(+5.60)#61 | 8.3%(+3.00)#3,939 |
| 2. | 29118 | 4.3% | 5.7%(-1.40)#238 | 8.3%(-4.00)#14,840 |
1
Common Questions
What are the Top Zip Codes with the Highest Percentage of Households Without a Vehicle in Orangeburg, SC?
Top Zip Codes with the Highest Percentage of Households Without a Vehicle in Orangeburg, SC are:
What zip code has the Highest Percentage of Households Without a Vehicle in Orangeburg, SC?
29115 has the Highest Percentage of Households Without a Vehicle in Orangeburg, SC with 11.3%.
What is the Percentage of Households Without a Vehicle in Orangeburg, SC?
Percentage of Households Without a Vehicle in Orangeburg is 14.5%.
What is the Percentage of Households Without a Vehicle in South Carolina?
Percentage of Households Without a Vehicle in South Carolina is 5.7%.
What is the Percentage of Households Without a Vehicle in the United States?
Percentage of Households Without a Vehicle in the United States is 8.3%.