Zip Codes with the Highest Percentage of Population Employed in Health Diagnosing & Treating in Orangeburg, SC
RELATED REPORTS & OPTIONS
Health Diagnosing & Treating
Orangeburg
Compare Zip Codes
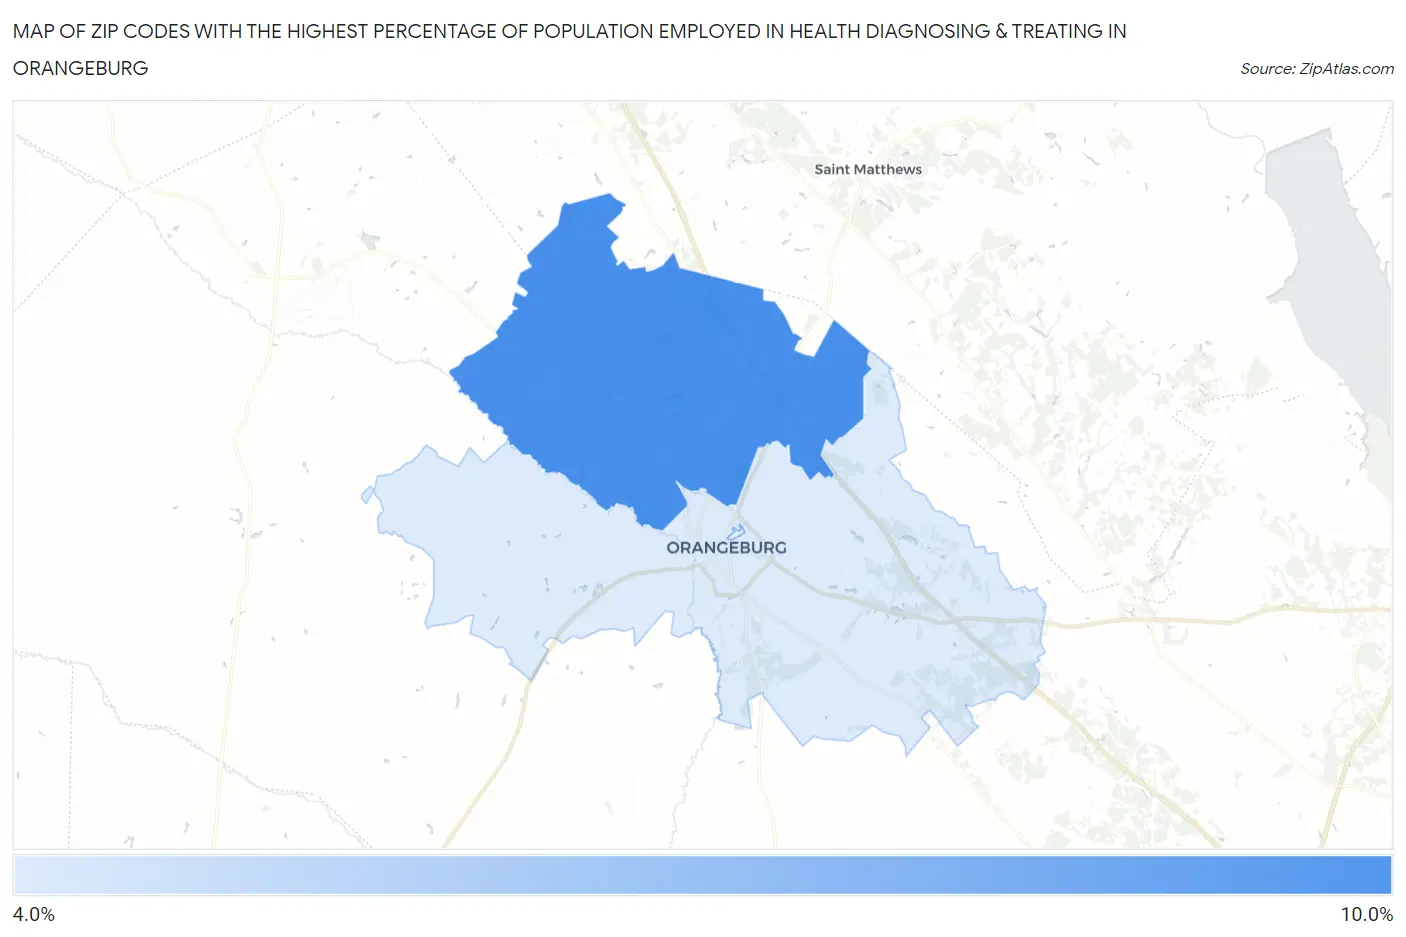
Map of Zip Codes with the Highest Percentage of Population Employed in Health Diagnosing & Treating in Orangeburg
4.9%
8.9%
Zip Codes with the Highest Percentage of Population Employed in Health Diagnosing & Treating in Orangeburg, SC
| Zip Code | % Employed | vs State | vs National | |
| 1. | 29118 | 8.9% | 6.7%(+2.13)#70 | 6.2%(+2.61)#5,627 |
| 2. | 29115 | 4.9% | 6.7%(-1.77)#241 | 6.2%(-1.30)#17,911 |
1
Common Questions
What are the Top Zip Codes with the Highest Percentage of Population Employed in Health Diagnosing & Treating in Orangeburg, SC?
Top Zip Codes with the Highest Percentage of Population Employed in Health Diagnosing & Treating in Orangeburg, SC are:
What zip code has the Highest Percentage of Population Employed in Health Diagnosing & Treating in Orangeburg, SC?
29118 has the Highest Percentage of Population Employed in Health Diagnosing & Treating in Orangeburg, SC with 8.9%.
What is the Percentage of Population Employed in Health Diagnosing & Treating in Orangeburg, SC?
Percentage of Population Employed in Health Diagnosing & Treating in Orangeburg is 6.2%.
What is the Percentage of Population Employed in Health Diagnosing & Treating in South Carolina?
Percentage of Population Employed in Health Diagnosing & Treating in South Carolina is 6.7%.
What is the Percentage of Population Employed in Health Diagnosing & Treating in the United States?
Percentage of Population Employed in Health Diagnosing & Treating in the United States is 6.2%.