Zip Codes with the Highest Percentage of Population Employed in Food Preparation & Serving in Conway, SC
RELATED REPORTS & OPTIONS
Food Preparation & Serving
Conway
Compare Zip Codes
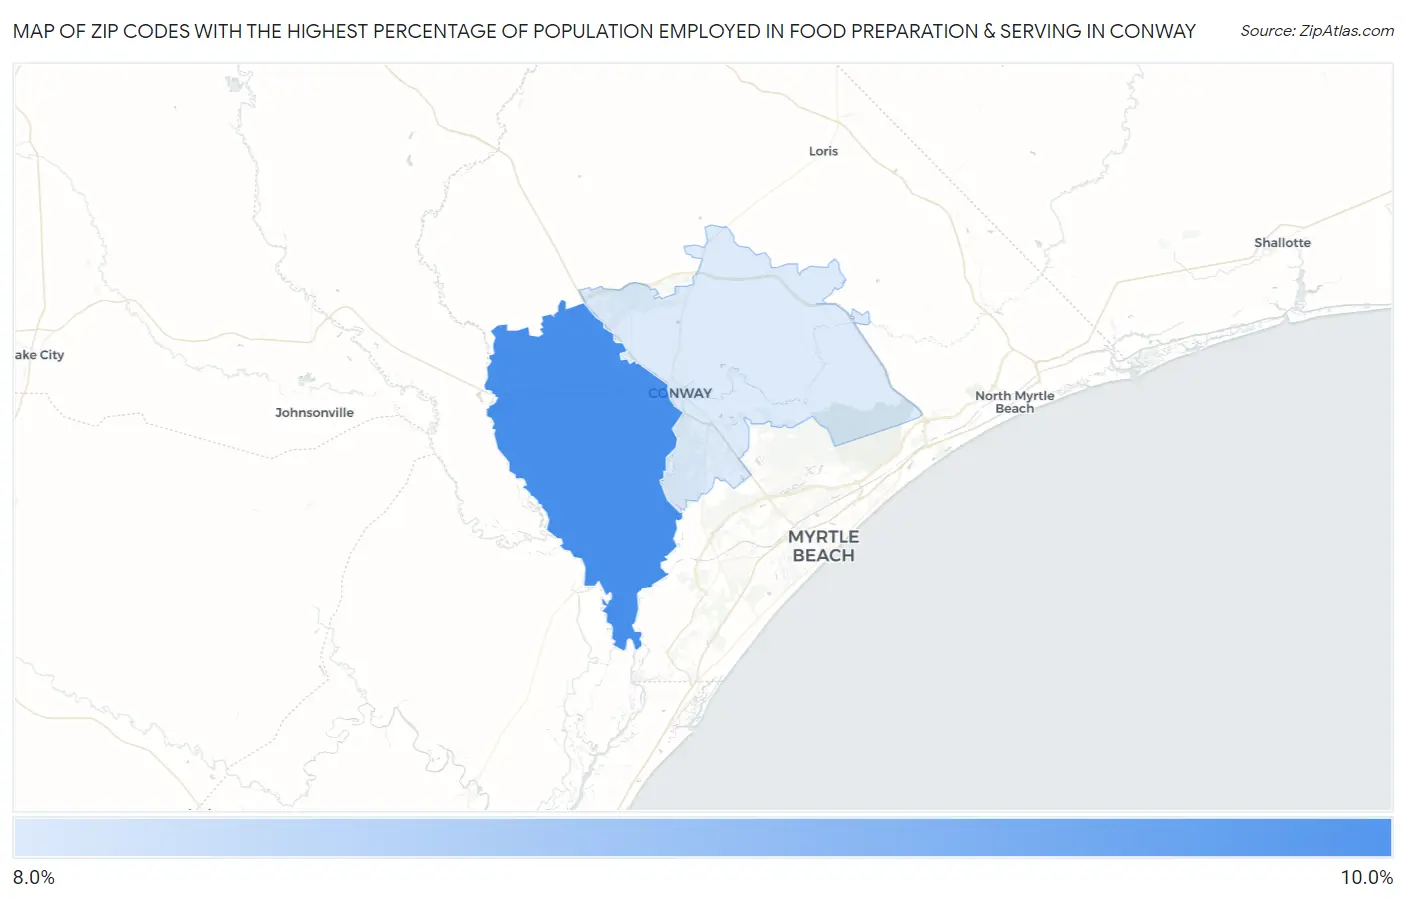
Map of Zip Codes with the Highest Percentage of Population Employed in Food Preparation & Serving in Conway
8.5%
9.3%
Zip Codes with the Highest Percentage of Population Employed in Food Preparation & Serving in Conway, SC
| Zip Code | % Employed | vs State | vs National | |
| 1. | 29527 | 9.3% | 5.8%(+3.53)#60 | 5.3%(+4.02)#3,235 |
| 2. | 29526 | 8.5% | 5.8%(+2.74)#75 | 5.3%(+3.22)#4,066 |
1
Common Questions
What are the Top Zip Codes with the Highest Percentage of Population Employed in Food Preparation & Serving in Conway, SC?
Top Zip Codes with the Highest Percentage of Population Employed in Food Preparation & Serving in Conway, SC are:
What zip code has the Highest Percentage of Population Employed in Food Preparation & Serving in Conway, SC?
29527 has the Highest Percentage of Population Employed in Food Preparation & Serving in Conway, SC with 9.3%.
What is the Percentage of Population Employed in Food Preparation & Serving in Conway, SC?
Percentage of Population Employed in Food Preparation & Serving in Conway is 10.2%.
What is the Percentage of Population Employed in Food Preparation & Serving in South Carolina?
Percentage of Population Employed in Food Preparation & Serving in South Carolina is 5.8%.
What is the Percentage of Population Employed in Food Preparation & Serving in the United States?
Percentage of Population Employed in Food Preparation & Serving in the United States is 5.3%.