Zip Codes with the Highest Percentage of Population Employed in Health Diagnosing & Treating in Conway, SC
RELATED REPORTS & OPTIONS
Health Diagnosing & Treating
Conway
Compare Zip Codes
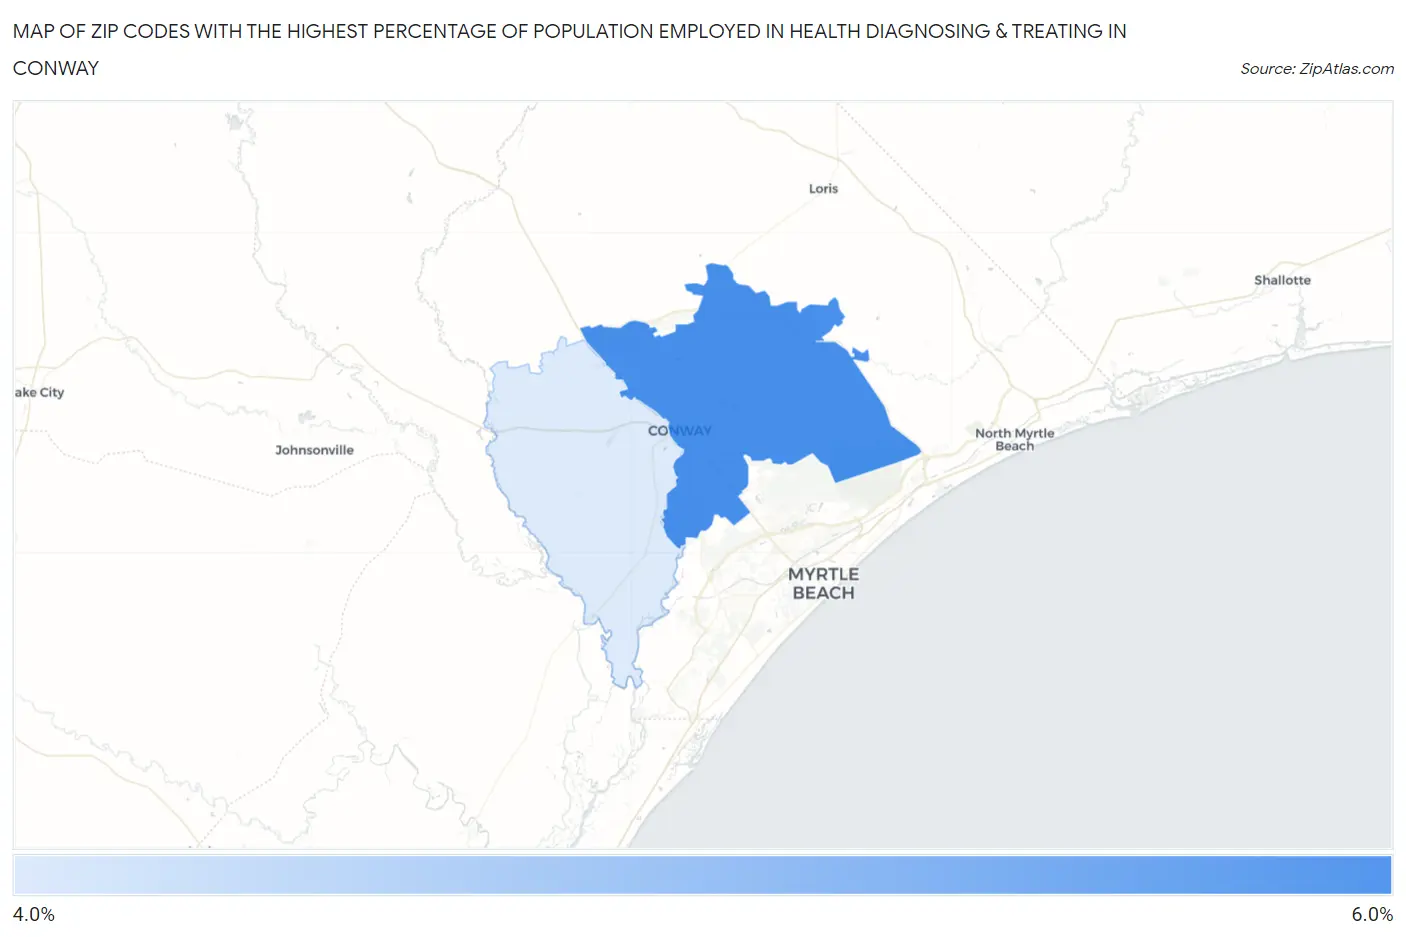
Map of Zip Codes with the Highest Percentage of Population Employed in Health Diagnosing & Treating in Conway
4.5%
5.7%
Zip Codes with the Highest Percentage of Population Employed in Health Diagnosing & Treating in Conway, SC
| Zip Code | % Employed | vs State | vs National | |
| 1. | 29526 | 5.7% | 6.7%(-1.07)#205 | 6.2%(-0.592)#15,174 |
| 2. | 29527 | 4.5% | 6.7%(-2.25)#260 | 6.2%(-1.77)#19,724 |
1
Common Questions
What are the Top Zip Codes with the Highest Percentage of Population Employed in Health Diagnosing & Treating in Conway, SC?
Top Zip Codes with the Highest Percentage of Population Employed in Health Diagnosing & Treating in Conway, SC are:
What zip code has the Highest Percentage of Population Employed in Health Diagnosing & Treating in Conway, SC?
29526 has the Highest Percentage of Population Employed in Health Diagnosing & Treating in Conway, SC with 5.7%.
What is the Percentage of Population Employed in Health Diagnosing & Treating in Conway, SC?
Percentage of Population Employed in Health Diagnosing & Treating in Conway is 4.4%.
What is the Percentage of Population Employed in Health Diagnosing & Treating in South Carolina?
Percentage of Population Employed in Health Diagnosing & Treating in South Carolina is 6.7%.
What is the Percentage of Population Employed in Health Diagnosing & Treating in the United States?
Percentage of Population Employed in Health Diagnosing & Treating in the United States is 6.2%.