Zip Codes with the Highest Percentage of Population with a Degree in Liberal Arts and History in Conway, SC
RELATED REPORTS & OPTIONS
Liberal Arts and History
Conway
Compare Zip Codes
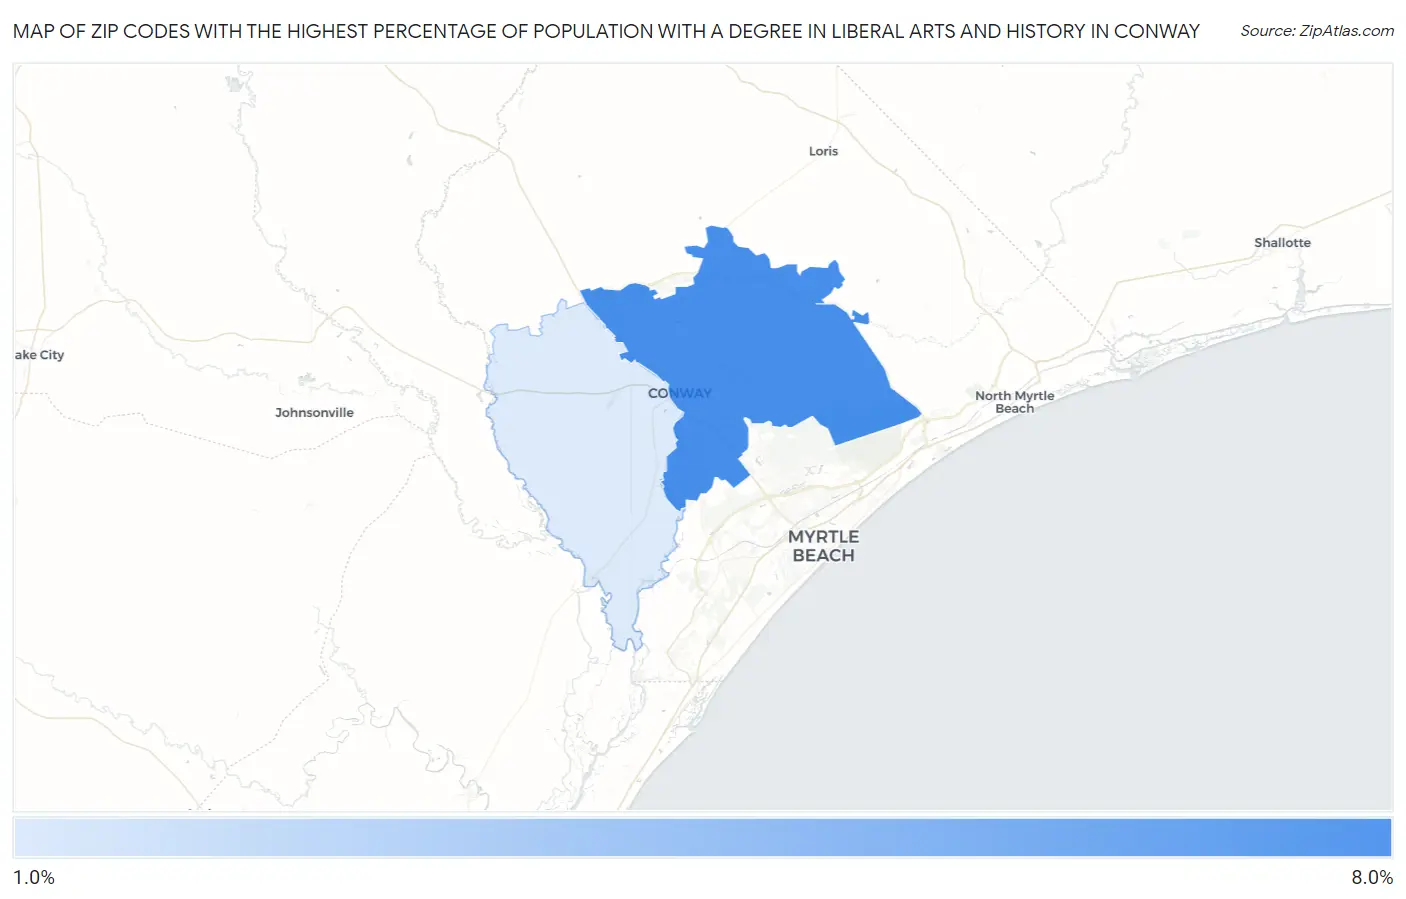
Map of Zip Codes with the Highest Percentage of Population with a Degree in Liberal Arts and History in Conway
1.8%
6.5%
Zip Codes with the Highest Percentage of Population with a Degree in Liberal Arts and History in Conway, SC
| Zip Code | % Graduates | vs State | vs National | |
| 1. | 29526 | 6.5% | 5.2%(+1.35)#113 | 4.9%(+1.68)#7,248 |
| 2. | 29527 | 1.8% | 5.2%(-3.42)#300 | 4.9%(-3.09)#21,893 |
1
Common Questions
What are the Top Zip Codes with the Highest Percentage of Population with a Degree in Liberal Arts and History in Conway, SC?
Top Zip Codes with the Highest Percentage of Population with a Degree in Liberal Arts and History in Conway, SC are:
What zip code has the Highest Percentage of Population with a Degree in Liberal Arts and History in Conway, SC?
29526 has the Highest Percentage of Population with a Degree in Liberal Arts and History in Conway, SC with 6.5%.
What is the Percentage of Population with a Degree in Liberal Arts and History in Conway, SC?
Percentage of Population with a Degree in Liberal Arts and History in Conway is 7.4%.
What is the Percentage of Population with a Degree in Liberal Arts and History in South Carolina?
Percentage of Population with a Degree in Liberal Arts and History in South Carolina is 5.2%.
What is the Percentage of Population with a Degree in Liberal Arts and History in the United States?
Percentage of Population with a Degree in Liberal Arts and History in the United States is 4.9%.