Zip Codes with the Highest Percentage of Population Employed in Architecture & Engineering in Conway, SC
RELATED REPORTS & OPTIONS
Architecture & Engineering
Conway
Compare Zip Codes
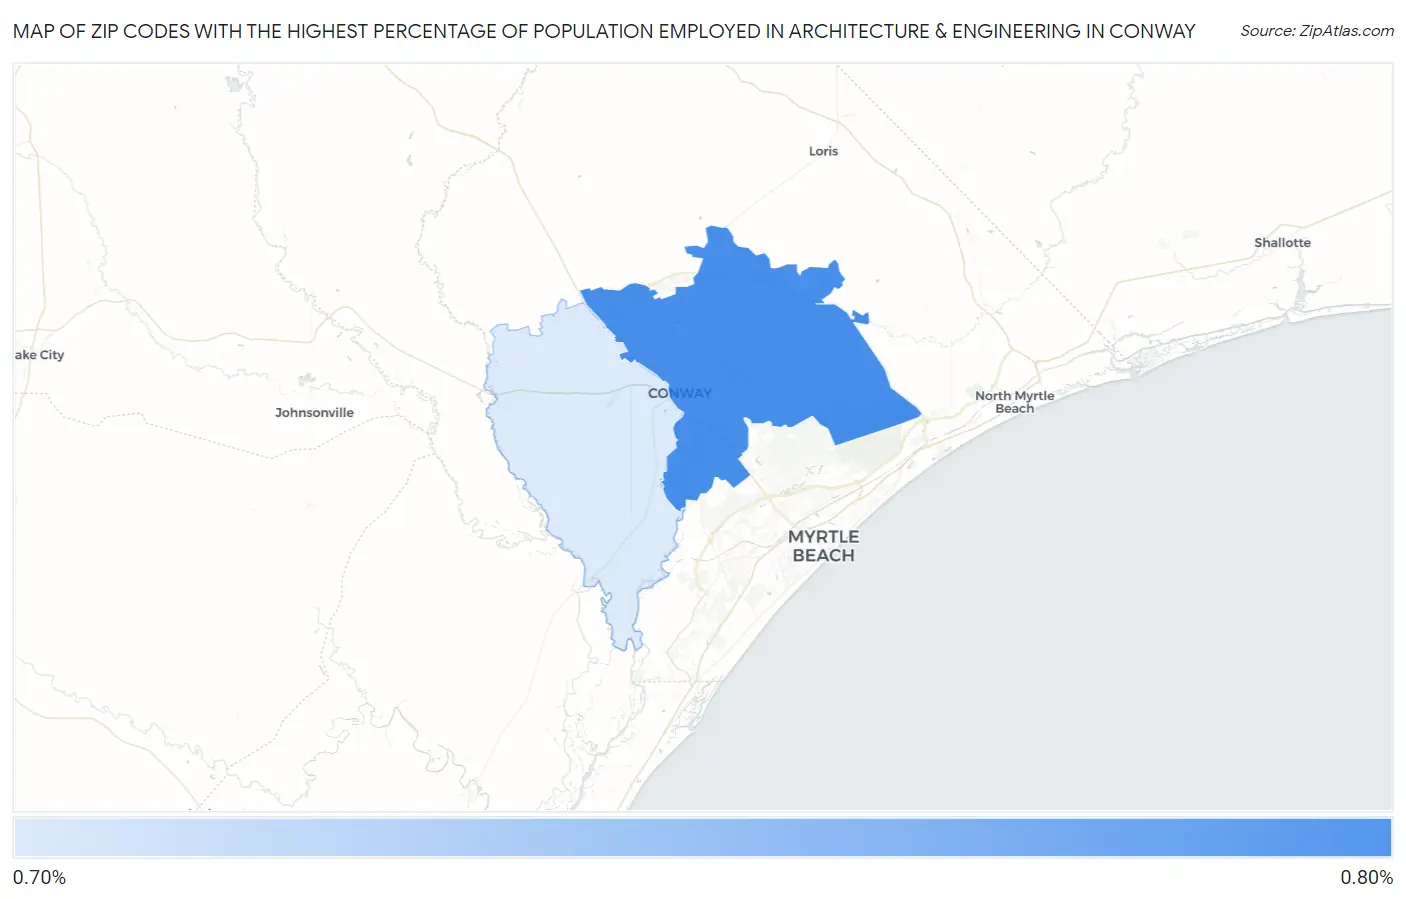
Map of Zip Codes with the Highest Percentage of Population Employed in Architecture & Engineering in Conway
0.71%
0.71%
Zip Codes with the Highest Percentage of Population Employed in Architecture & Engineering in Conway, SC
| Zip Code | % Employed | vs State | vs National | |
| 1. | 29526 | 0.71% | 2.2%(-1.49)#258 | 2.1%(-1.44)#18,824 |
| 2. | 29527 | 0.71% | 2.2%(-1.49)#260 | 2.1%(-1.44)#18,854 |
1
Common Questions
What are the Top Zip Codes with the Highest Percentage of Population Employed in Architecture & Engineering in Conway, SC?
Top Zip Codes with the Highest Percentage of Population Employed in Architecture & Engineering in Conway, SC are:
What zip code has the Highest Percentage of Population Employed in Architecture & Engineering in Conway, SC?
29526 has the Highest Percentage of Population Employed in Architecture & Engineering in Conway, SC with 0.71%.
What is the Percentage of Population Employed in Architecture & Engineering in Conway, SC?
Percentage of Population Employed in Architecture & Engineering in Conway is 0.37%.
What is the Percentage of Population Employed in Architecture & Engineering in South Carolina?
Percentage of Population Employed in Architecture & Engineering in South Carolina is 2.2%.
What is the Percentage of Population Employed in Architecture & Engineering in the United States?
Percentage of Population Employed in Architecture & Engineering in the United States is 2.1%.