Zip Codes with the Highest Percentage of Households with Income Below $10,000 in Cranston, RI
RELATED REPORTS & OPTIONS
Household Income | $0-10k
Cranston
Compare Zip Codes
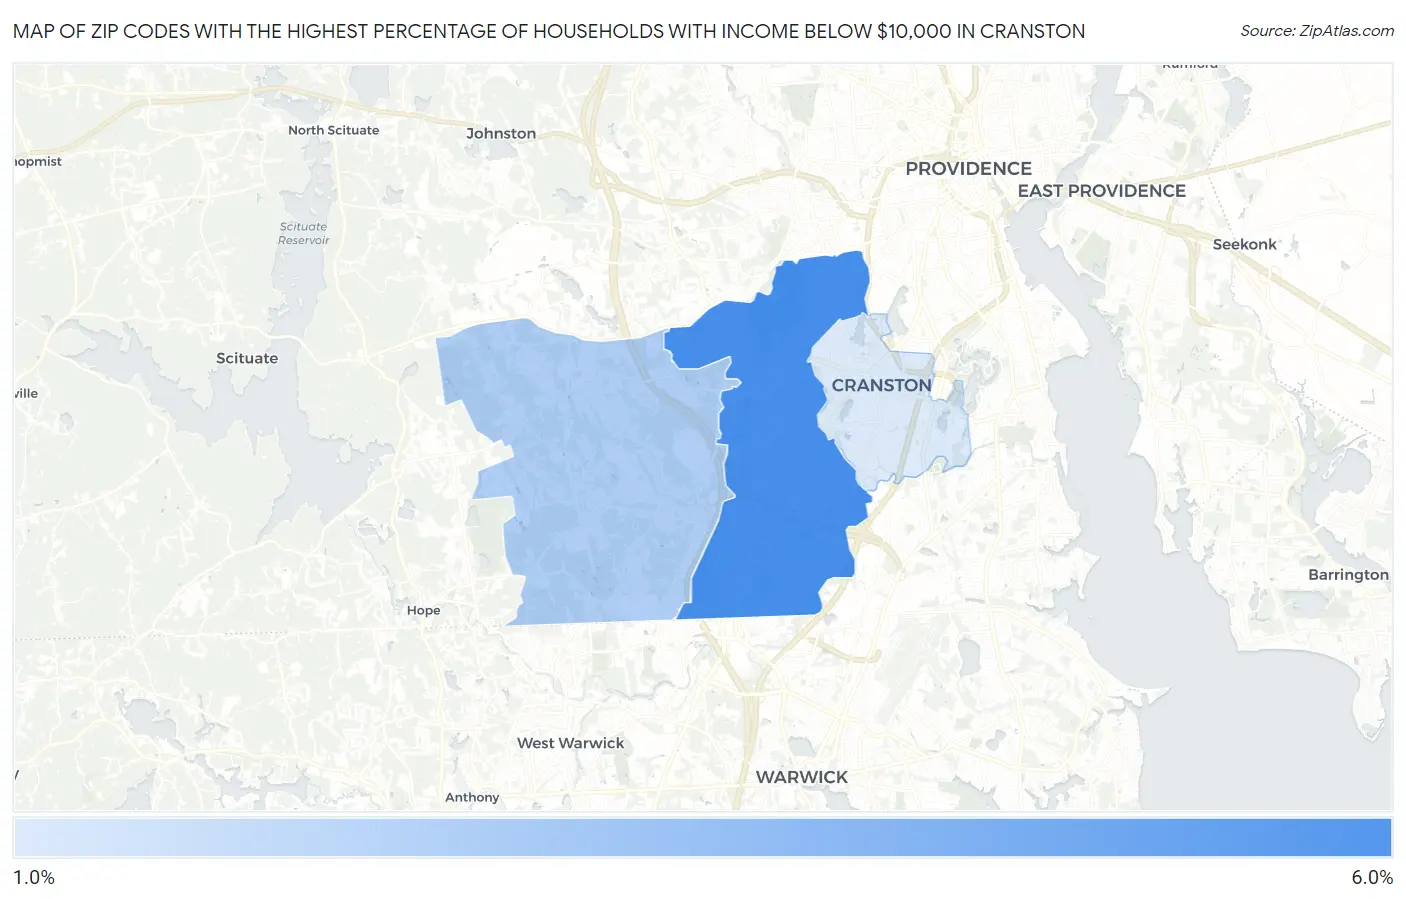
Map of Zip Codes with the Highest Percentage of Households with Income Below $10,000 in Cranston
1.3%
5.5%
Zip Codes with the Highest Percentage of Households with Income Below $10,000 in Cranston, RI
| Zip Code | Households with Income < $10k | vs State | vs National | |
| 1. | 02920 | 5.5% | 4.6%(+0.900)#19 | 4.9%(+0.600)#10,213 |
| 2. | 02921 | 2.6% | 4.6%(-2.00)#45 | 4.9%(-2.30)#21,213 |
| 3. | 02910 | 1.3% | 4.6%(-3.30)#53 | 4.9%(-3.60)#26,021 |
1
Common Questions
What are the Top Zip Codes with the Highest Percentage of Households with Income Below $10,000 in Cranston, RI?
Top Zip Codes with the Highest Percentage of Households with Income Below $10,000 in Cranston, RI are:
What zip code has the Highest Percentage of Households with Income Below $10,000 in Cranston, RI?
02920 has the Highest Percentage of Households with Income Below $10,000 in Cranston, RI with 5.5%.
What is the Percentage of Households with Income Below $10,000 in Cranston, RI?
Percentage of Households with Income Below $10,000 in Cranston is 4.3%.
What is the Percentage of Households with Income Below $10,000 in Rhode Island?
Percentage of Households with Income Below $10,000 in Rhode Island is 4.6%.
What is the Percentage of Households with Income Below $10,000 in the United States?
Percentage of Households with Income Below $10,000 in the United States is 4.9%.