Zip Codes with the Highest Percentage of Population Employed in Architecture & Engineering in Cranston, RI
RELATED REPORTS & OPTIONS
Architecture & Engineering
Cranston
Compare Zip Codes
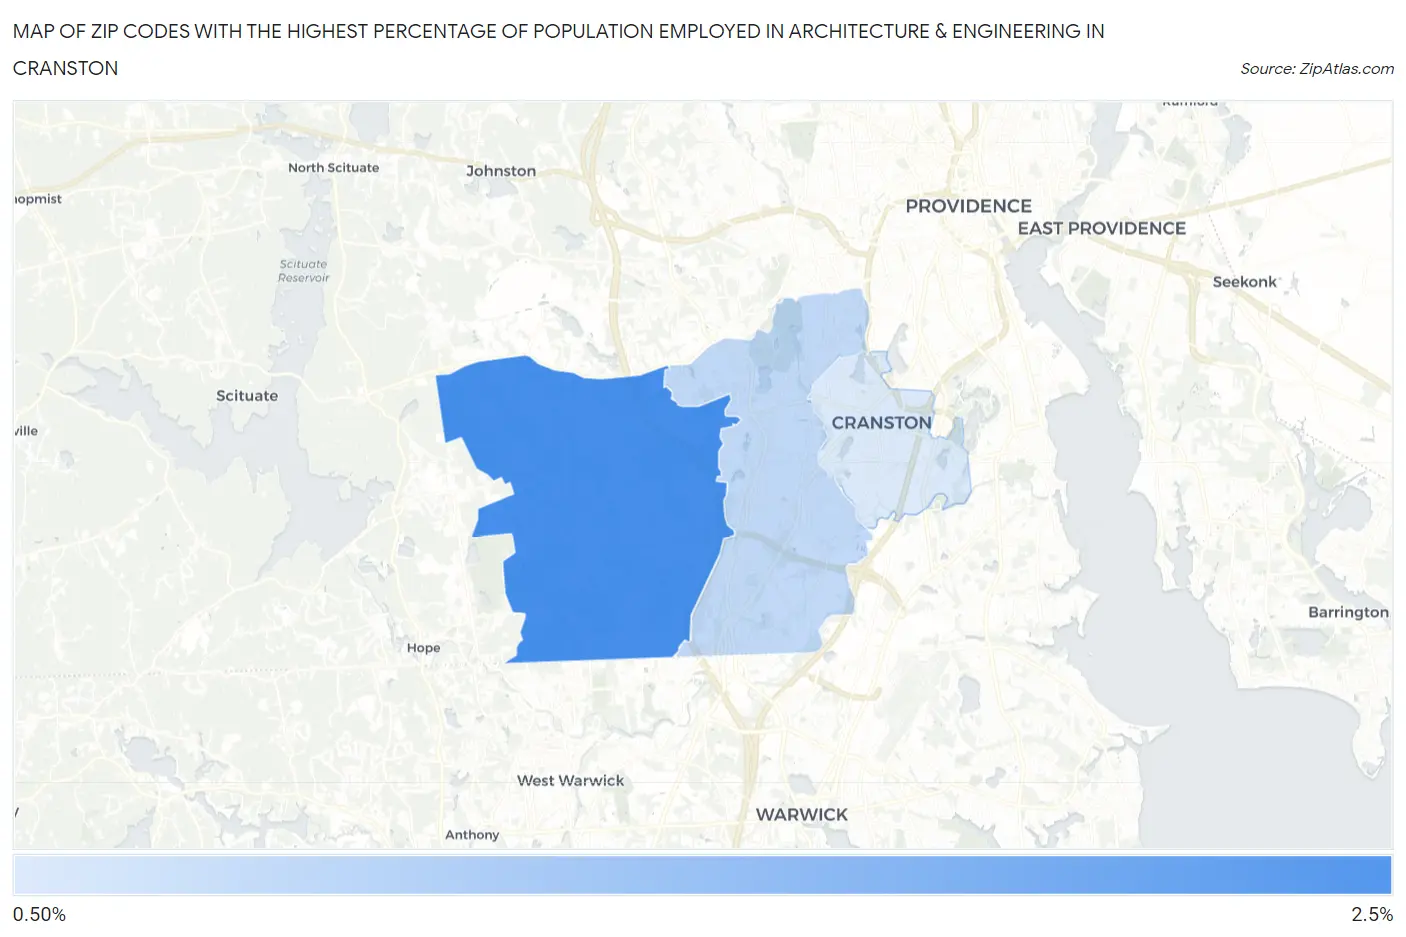
Map of Zip Codes with the Highest Percentage of Population Employed in Architecture & Engineering in Cranston
0.53%
2.4%
Zip Codes with the Highest Percentage of Population Employed in Architecture & Engineering in Cranston, RI
| Zip Code | % Employed | vs State | vs National | |
| 1. | 02921 | 2.4% | 2.2%(+0.166)#32 | 2.1%(+0.205)#7,699 |
| 2. | 02920 | 0.87% | 2.2%(-1.32)#60 | 2.1%(-1.28)#17,596 |
| 3. | 02910 | 0.53% | 2.2%(-1.66)#63 | 2.1%(-1.62)#20,081 |
1
Common Questions
What are the Top Zip Codes with the Highest Percentage of Population Employed in Architecture & Engineering in Cranston, RI?
Top Zip Codes with the Highest Percentage of Population Employed in Architecture & Engineering in Cranston, RI are:
What zip code has the Highest Percentage of Population Employed in Architecture & Engineering in Cranston, RI?
02921 has the Highest Percentage of Population Employed in Architecture & Engineering in Cranston, RI with 2.4%.
What is the Percentage of Population Employed in Architecture & Engineering in Cranston, RI?
Percentage of Population Employed in Architecture & Engineering in Cranston is 1.2%.
What is the Percentage of Population Employed in Architecture & Engineering in Rhode Island?
Percentage of Population Employed in Architecture & Engineering in Rhode Island is 2.2%.
What is the Percentage of Population Employed in Architecture & Engineering in the United States?
Percentage of Population Employed in Architecture & Engineering in the United States is 2.1%.