Zip Codes with the Highest Percentage of Families with Income Above $200,000 in Cranston, RI
RELATED REPORTS & OPTIONS
Family Income | $200k+
Cranston
Compare Zip Codes
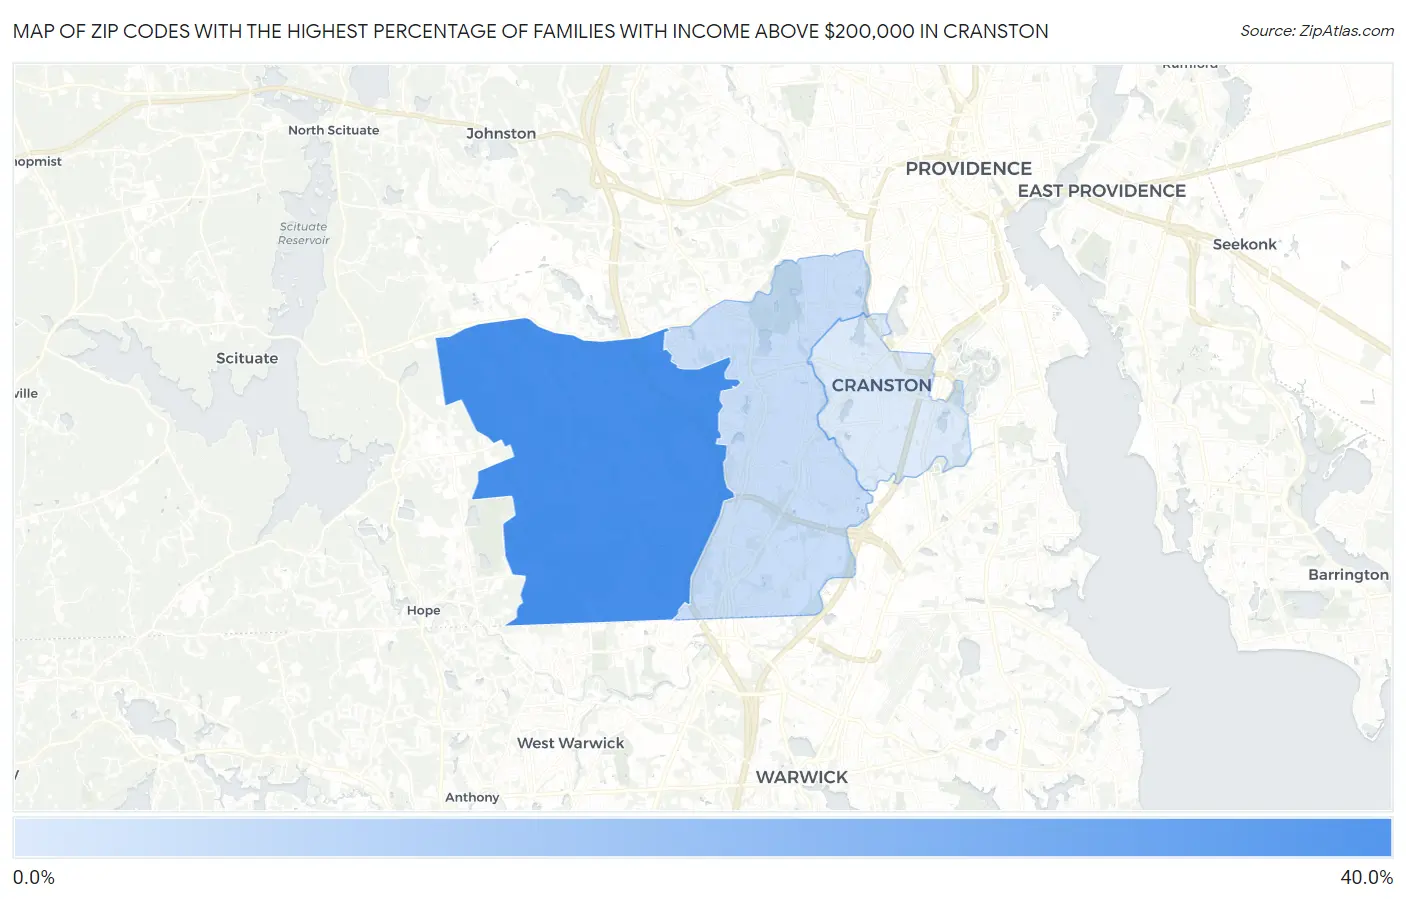
Map of Zip Codes with the Highest Percentage of Families with Income Above $200,000 in Cranston
6.9%
33.2%
Zip Codes with the Highest Percentage of Families with Income Above $200,000 in Cranston, RI
| Zip Code | Families with Income > $200k | vs State | vs National | |
| 1. | 02921 | 33.2% | 15.7%(+17.5)#9 | 14.8%(+18.4)#2,087 |
| 2. | 02920 | 10.1% | 15.7%(-5.60)#54 | 14.8%(-4.70)#10,685 |
| 3. | 02910 | 6.9% | 15.7%(-8.80)#60 | 14.8%(-7.90)#14,871 |
1
Common Questions
What are the Top Zip Codes with the Highest Percentage of Families with Income Above $200,000 in Cranston, RI?
Top Zip Codes with the Highest Percentage of Families with Income Above $200,000 in Cranston, RI are:
What zip code has the Highest Percentage of Families with Income Above $200,000 in Cranston, RI?
02921 has the Highest Percentage of Families with Income Above $200,000 in Cranston, RI with 33.2%.
What is the Percentage of Families with Income Above $200,000 in Cranston, RI?
Percentage of Families with Income Above $200,000 in Cranston is 14.8%.
What is the Percentage of Families with Income Above $200,000 in Rhode Island?
Percentage of Families with Income Above $200,000 in Rhode Island is 15.7%.
What is the Percentage of Families with Income Above $200,000 in the United States?
Percentage of Families with Income Above $200,000 in the United States is 14.8%.