Zip Codes with the Highest Percentage of Population Employed in Administrative & Support Services in Cranston, RI
RELATED REPORTS & OPTIONS
Administrative & Support Services
Cranston
Compare Zip Codes
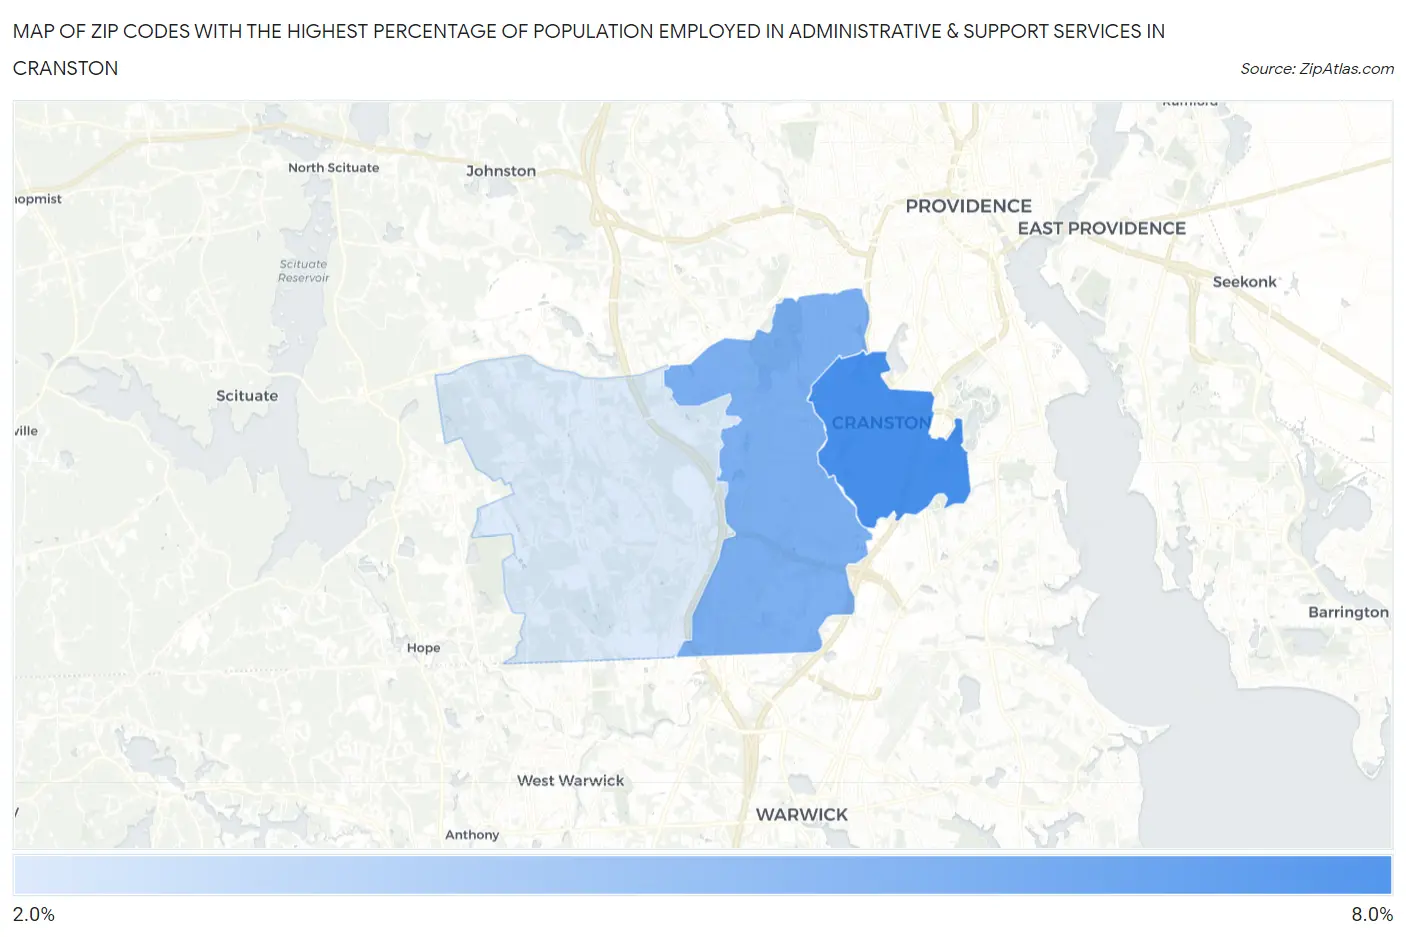
Map of Zip Codes with the Highest Percentage of Population Employed in Administrative & Support Services in Cranston
2.3%
6.0%
Zip Codes with the Highest Percentage of Population Employed in Administrative & Support Services in Cranston, RI
| Zip Code | % Employed | vs State | vs National | |
| 1. | 02910 | 6.0% | 3.9%(+2.09)#9 | 4.1%(+1.86)#4,769 |
| 2. | 02920 | 4.7% | 3.9%(+0.787)#17 | 4.1%(+0.555)#8,016 |
| 3. | 02921 | 2.3% | 3.9%(-1.61)#44 | 4.1%(-1.84)#19,133 |
1
Common Questions
What are the Top Zip Codes with the Highest Percentage of Population Employed in Administrative & Support Services in Cranston, RI?
Top Zip Codes with the Highest Percentage of Population Employed in Administrative & Support Services in Cranston, RI are:
What zip code has the Highest Percentage of Population Employed in Administrative & Support Services in Cranston, RI?
02910 has the Highest Percentage of Population Employed in Administrative & Support Services in Cranston, RI with 6.0%.
What is the Percentage of Population Employed in Administrative & Support Services in Cranston, RI?
Percentage of Population Employed in Administrative & Support Services in Cranston is 4.6%.
What is the Percentage of Population Employed in Administrative & Support Services in Rhode Island?
Percentage of Population Employed in Administrative & Support Services in Rhode Island is 3.9%.
What is the Percentage of Population Employed in Administrative & Support Services in the United States?
Percentage of Population Employed in Administrative & Support Services in the United States is 4.1%.