Zip Codes with the Highest Percentage of Population Employed in Security & Protection in Cranston, RI
RELATED REPORTS & OPTIONS
Security & Protection
Cranston
Compare Zip Codes
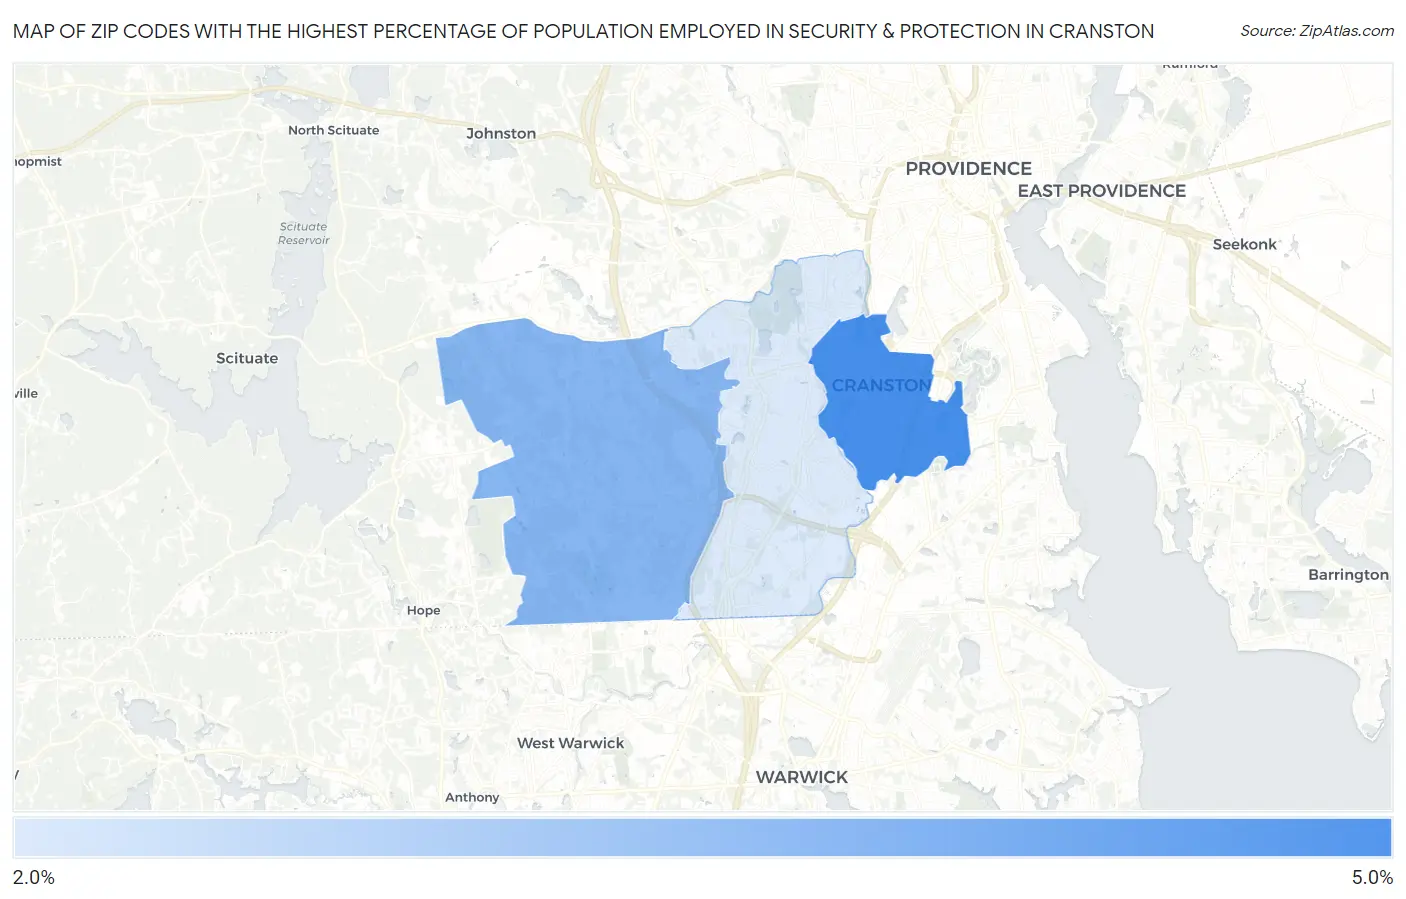
Map of Zip Codes with the Highest Percentage of Population Employed in Security & Protection in Cranston
2.6%
4.2%
Zip Codes with the Highest Percentage of Population Employed in Security & Protection in Cranston, RI
| Zip Code | % Employed | vs State | vs National | |
| 1. | 02910 | 4.2% | 2.4%(+1.77)#9 | 2.1%(+2.05)#4,121 |
| 2. | 02921 | 3.5% | 2.4%(+1.05)#17 | 2.1%(+1.34)#5,703 |
| 3. | 02920 | 2.6% | 2.4%(+0.143)#34 | 2.1%(+0.430)#9,108 |
1
Common Questions
What are the Top Zip Codes with the Highest Percentage of Population Employed in Security & Protection in Cranston, RI?
Top Zip Codes with the Highest Percentage of Population Employed in Security & Protection in Cranston, RI are:
What zip code has the Highest Percentage of Population Employed in Security & Protection in Cranston, RI?
02910 has the Highest Percentage of Population Employed in Security & Protection in Cranston, RI with 4.2%.
What is the Percentage of Population Employed in Security & Protection in Cranston, RI?
Percentage of Population Employed in Security & Protection in Cranston is 3.0%.
What is the Percentage of Population Employed in Security & Protection in Rhode Island?
Percentage of Population Employed in Security & Protection in Rhode Island is 2.4%.
What is the Percentage of Population Employed in Security & Protection in the United States?
Percentage of Population Employed in Security & Protection in the United States is 2.1%.