Zip Codes with the Highest Percentage of Households with Income Below $10,000 in Warwick, RI
RELATED REPORTS & OPTIONS
Household Income | $0-10k
Warwick
Compare Zip Codes
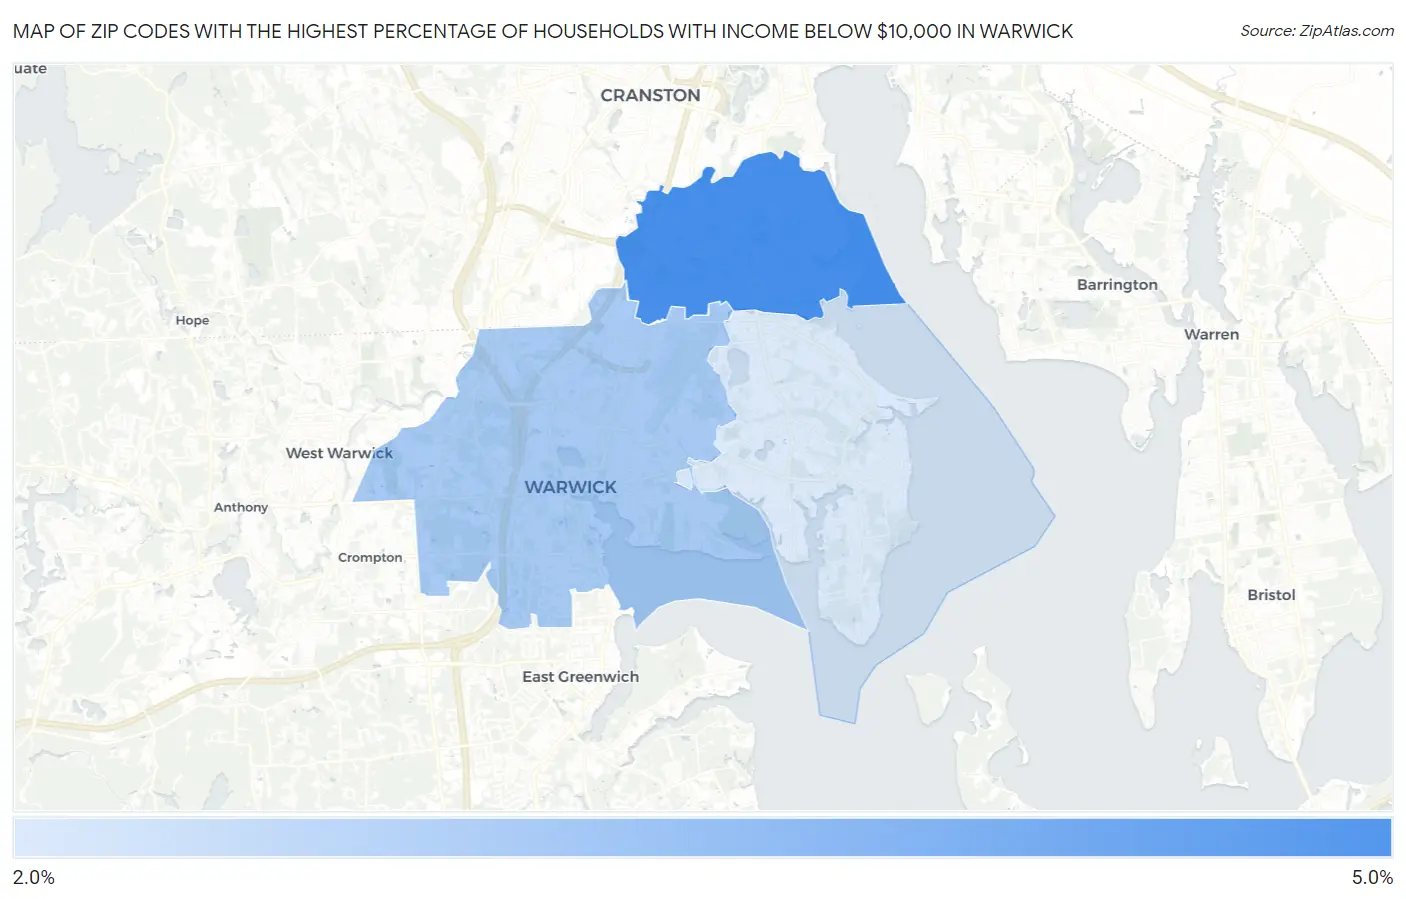
Map of Zip Codes with the Highest Percentage of Households with Income Below $10,000 in Warwick
2.7%
4.1%
Zip Codes with the Highest Percentage of Households with Income Below $10,000 in Warwick, RI
| Zip Code | Households with Income < $10k | vs State | vs National | |
| 1. | 02888 | 4.1% | 4.6%(-0.500)#28 | 4.9%(-0.800)#14,906 |
| 2. | 02886 | 3.2% | 4.6%(-1.40)#36 | 4.9%(-1.70)#18,502 |
| 3. | 02889 | 2.7% | 4.6%(-1.90)#43 | 4.9%(-2.20)#20,717 |
1
Common Questions
What are the Top Zip Codes with the Highest Percentage of Households with Income Below $10,000 in Warwick, RI?
Top Zip Codes with the Highest Percentage of Households with Income Below $10,000 in Warwick, RI are:
What zip code has the Highest Percentage of Households with Income Below $10,000 in Warwick, RI?
02888 has the Highest Percentage of Households with Income Below $10,000 in Warwick, RI with 4.1%.
What is the Percentage of Households with Income Below $10,000 in Warwick, RI?
Percentage of Households with Income Below $10,000 in Warwick is 3.1%.
What is the Percentage of Households with Income Below $10,000 in Rhode Island?
Percentage of Households with Income Below $10,000 in Rhode Island is 4.6%.
What is the Percentage of Households with Income Below $10,000 in the United States?
Percentage of Households with Income Below $10,000 in the United States is 4.9%.