Zip Codes with the Highest Percentage of Population Employed in Accommodation & Food Services in Cranston, RI
RELATED REPORTS & OPTIONS
Accommodation & Food Services
Cranston
Compare Zip Codes
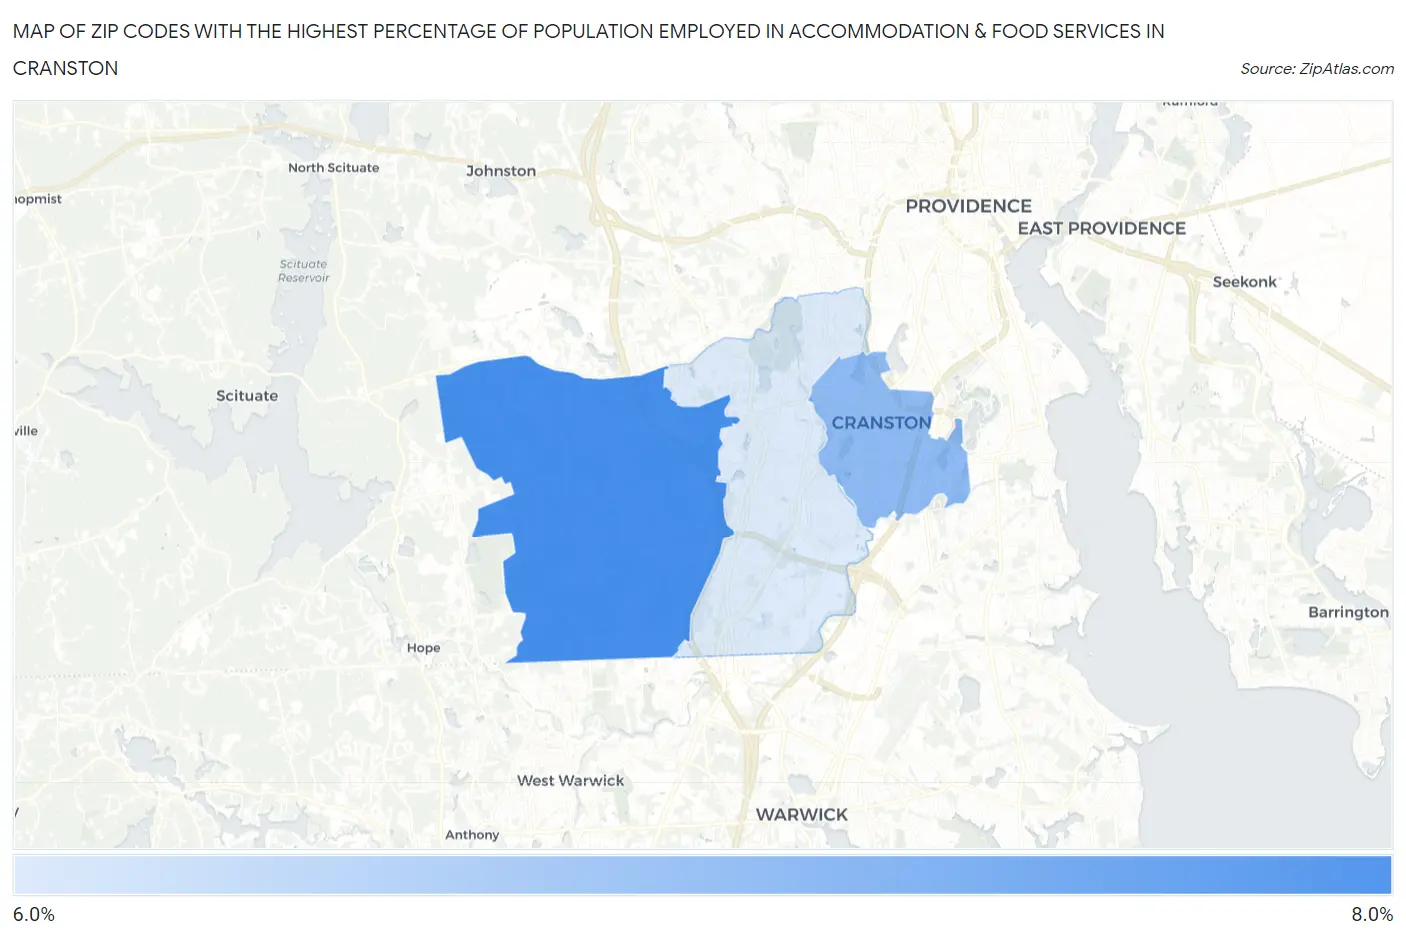
Map of Zip Codes with the Highest Percentage of Population Employed in Accommodation & Food Services in Cranston
6.7%
7.9%
Zip Codes with the Highest Percentage of Population Employed in Accommodation & Food Services in Cranston, RI
| Zip Code | % Employed | vs State | vs National | |
| 1. | 02921 | 7.9% | 7.0%(+0.862)#23 | 6.9%(+0.991)#8,094 |
| 2. | 02910 | 7.3% | 7.0%(+0.293)#29 | 6.9%(+0.423)#9,502 |
| 3. | 02920 | 6.7% | 7.0%(-0.325)#35 | 6.9%(-0.195)#11,240 |
1
Common Questions
What are the Top Zip Codes with the Highest Percentage of Population Employed in Accommodation & Food Services in Cranston, RI?
Top Zip Codes with the Highest Percentage of Population Employed in Accommodation & Food Services in Cranston, RI are:
What zip code has the Highest Percentage of Population Employed in Accommodation & Food Services in Cranston, RI?
02921 has the Highest Percentage of Population Employed in Accommodation & Food Services in Cranston, RI with 7.9%.
What is the Percentage of Population Employed in Accommodation & Food Services in Cranston, RI?
Percentage of Population Employed in Accommodation & Food Services in Cranston is 7.1%.
What is the Percentage of Population Employed in Accommodation & Food Services in Rhode Island?
Percentage of Population Employed in Accommodation & Food Services in Rhode Island is 7.0%.
What is the Percentage of Population Employed in Accommodation & Food Services in the United States?
Percentage of Population Employed in Accommodation & Food Services in the United States is 6.9%.