Zip Codes with the Highest Percentage of Population Employed in Legal Services & Support in Cranston, RI
RELATED REPORTS & OPTIONS
Legal Services & Support
Cranston
Compare Zip Codes
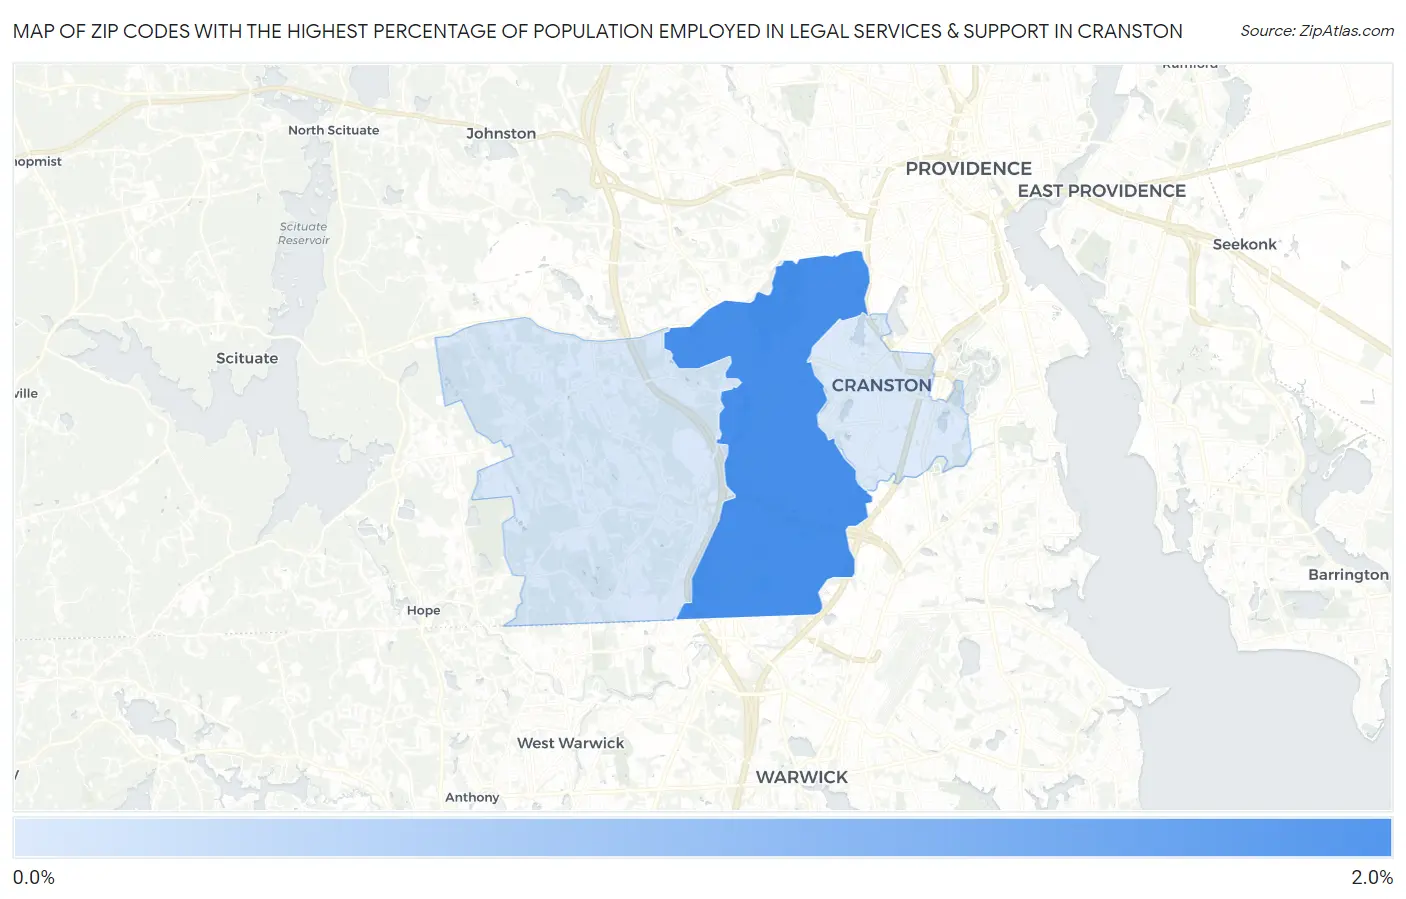
Map of Zip Codes with the Highest Percentage of Population Employed in Legal Services & Support in Cranston
0.87%
1.7%
Zip Codes with the Highest Percentage of Population Employed in Legal Services & Support in Cranston, RI
| Zip Code | % Employed | vs State | vs National | |
| 1. | 02920 | 1.7% | 1.2%(+0.485)#17 | 1.2%(+0.489)#4,410 |
| 2. | 02921 | 0.90% | 1.2%(-0.290)#39 | 1.2%(-0.286)#8,621 |
| 3. | 02910 | 0.87% | 1.2%(-0.318)#41 | 1.2%(-0.314)#8,859 |
1
Common Questions
What are the Top Zip Codes with the Highest Percentage of Population Employed in Legal Services & Support in Cranston, RI?
Top Zip Codes with the Highest Percentage of Population Employed in Legal Services & Support in Cranston, RI are:
What zip code has the Highest Percentage of Population Employed in Legal Services & Support in Cranston, RI?
02920 has the Highest Percentage of Population Employed in Legal Services & Support in Cranston, RI with 1.7%.
What is the Percentage of Population Employed in Legal Services & Support in Cranston, RI?
Percentage of Population Employed in Legal Services & Support in Cranston is 1.3%.
What is the Percentage of Population Employed in Legal Services & Support in Rhode Island?
Percentage of Population Employed in Legal Services & Support in Rhode Island is 1.2%.
What is the Percentage of Population Employed in Legal Services & Support in the United States?
Percentage of Population Employed in Legal Services & Support in the United States is 1.2%.