Zip Codes with the Highest Percentage of Households Without a Vehicle in New Castle, PA
RELATED REPORTS & OPTIONS
Households without a Cars
New Castle
Compare Zip Codes
Map of Zip Codes with the Highest Percentage of Households Without a Vehicle in New Castle
5.6%
11.3%
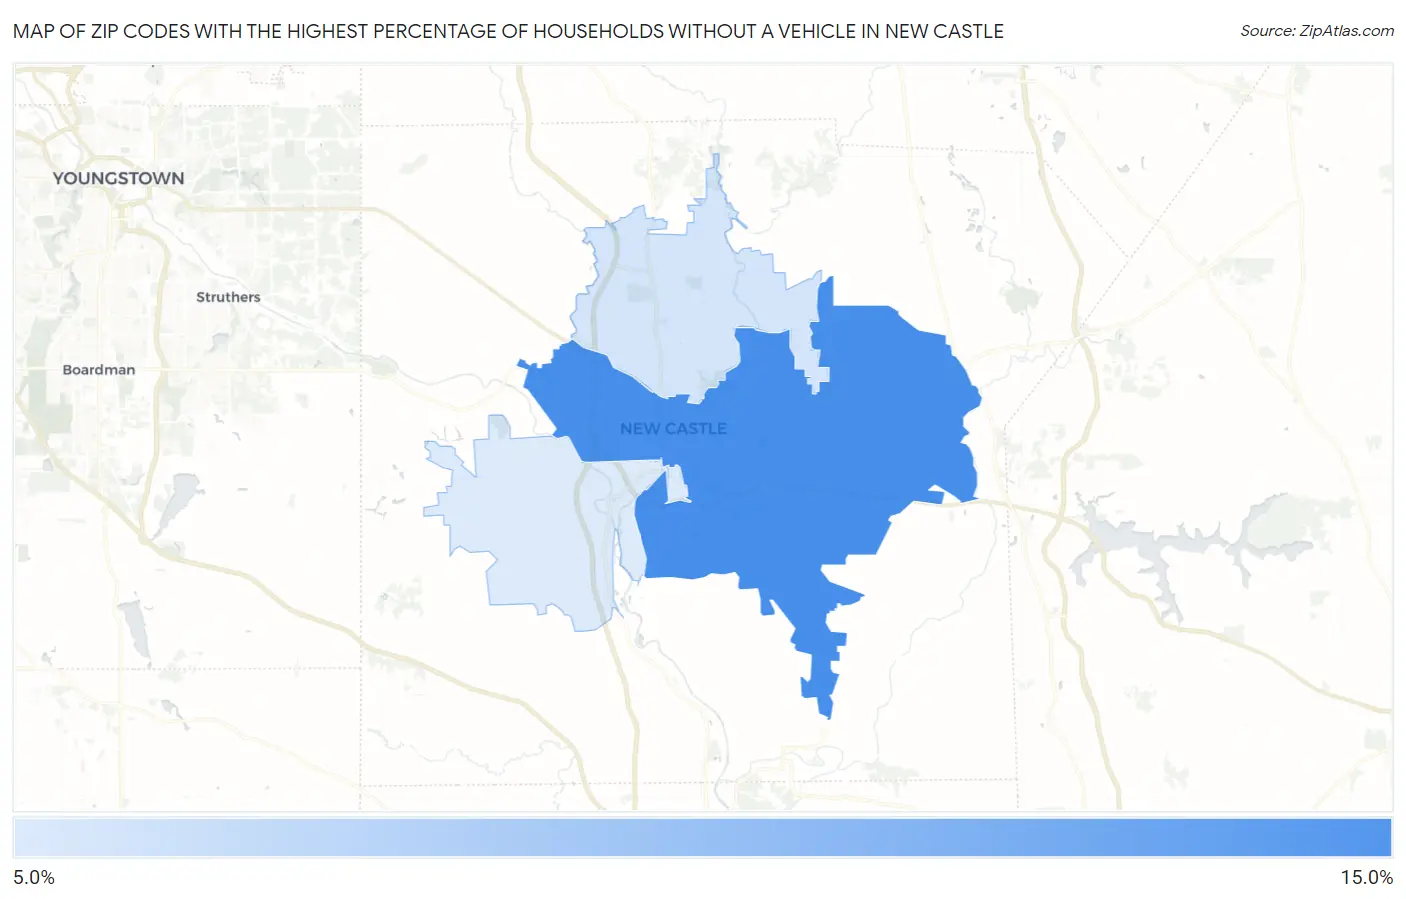
Zip Codes with the Highest Percentage of Households Without a Vehicle in New Castle, PA
| Zip Code | Housholds Without a Car | vs State | vs National | |
| 1. | 16101 | 11.3% | 10.6%(+0.700)#313 | 8.3%(+3.00)#3,938 |
| 2. | 16105 | 5.9% | 10.6%(-4.70)#741 | 8.3%(-2.40)#10,724 |
| 3. | 16102 | 5.6% | 10.6%(-5.00)#790 | 8.3%(-2.70)#11,453 |
1
Common Questions
What are the Top Zip Codes with the Highest Percentage of Households Without a Vehicle in New Castle, PA?
Top Zip Codes with the Highest Percentage of Households Without a Vehicle in New Castle, PA are:
What zip code has the Highest Percentage of Households Without a Vehicle in New Castle, PA?
16101 has the Highest Percentage of Households Without a Vehicle in New Castle, PA with 11.3%.
What is the Percentage of Households Without a Vehicle in New Castle, PA?
Percentage of Households Without a Vehicle in New Castle is 15.1%.
What is the Percentage of Households Without a Vehicle in Pennsylvania?
Percentage of Households Without a Vehicle in Pennsylvania is 10.6%.
What is the Percentage of Households Without a Vehicle in the United States?
Percentage of Households Without a Vehicle in the United States is 8.3%.