Zip Codes with the Highest Percentage of Households Without a Vehicle in Butler, PA
RELATED REPORTS & OPTIONS
Households without a Cars
Butler
Compare Zip Codes
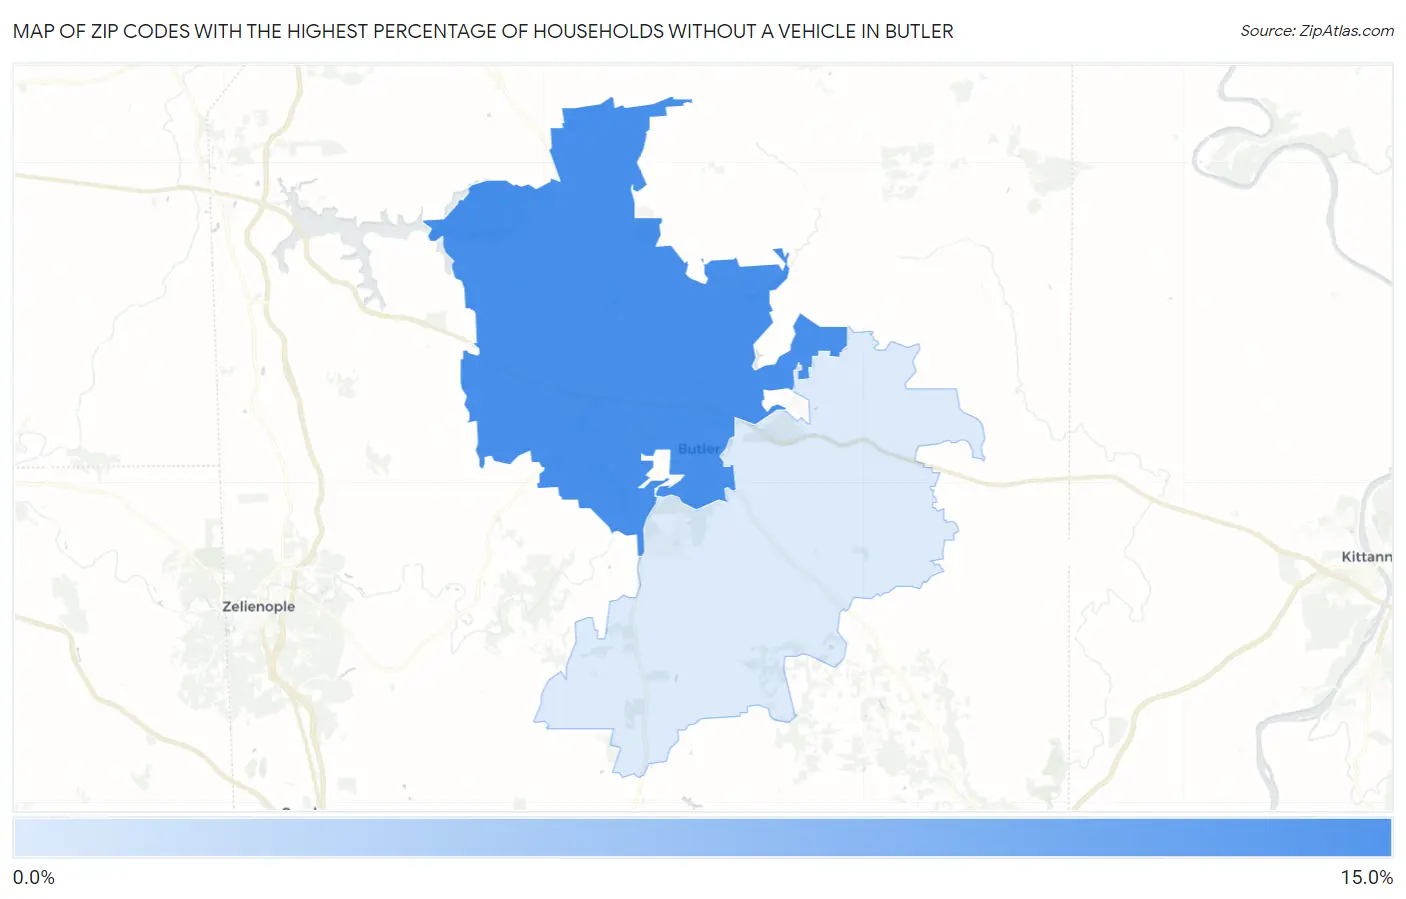
Map of Zip Codes with the Highest Percentage of Households Without a Vehicle in Butler
4.5%
11.9%
Zip Codes with the Highest Percentage of Households Without a Vehicle in Butler, PA
| Zip Code | Housholds Without a Car | vs State | vs National | |
| 1. | 16001 | 11.9% | 10.6%(+1.30)#289 | 8.3%(+3.60)#3,604 |
| 2. | 16002 | 4.5% | 10.6%(-6.10)#941 | 8.3%(-3.80)#14,231 |
1
Common Questions
What are the Top Zip Codes with the Highest Percentage of Households Without a Vehicle in Butler, PA?
Top Zip Codes with the Highest Percentage of Households Without a Vehicle in Butler, PA are:
What zip code has the Highest Percentage of Households Without a Vehicle in Butler, PA?
16001 has the Highest Percentage of Households Without a Vehicle in Butler, PA with 11.9%.
What is the Percentage of Households Without a Vehicle in Butler, PA?
Percentage of Households Without a Vehicle in Butler is 24.9%.
What is the Percentage of Households Without a Vehicle in Pennsylvania?
Percentage of Households Without a Vehicle in Pennsylvania is 10.6%.
What is the Percentage of Households Without a Vehicle in the United States?
Percentage of Households Without a Vehicle in the United States is 8.3%.