Zip Codes with the Highest Percentage of Households Heated by Bottled Gas / Liquid Propane in Portland, OR

RELATED REPORTS & OPTIONS

Bottled Gas / LP Heating
Population
Families and Households
Female Fertility
Female Fertility (Unmarried)
Race (Community Size)
Race (Percentage)
Ancestry (Community Size)
AfghanAfricanAlaska NativeAlaskan AthabascanAlbanianAleutAlsatianAmericanApacheArabArgentineanArmenianAustralianAustrianBahamianBangladeshiBasqueBelgianBelizeanBhutaneseBlackfeetBolivianBrazilianBritishBritish West IndianBulgarianBurmeseCajunCambodianCanadianCelticCentral AmericanCentral American IndianCherokeeCheyenneChickasawChileanChineseChippewaChoctawColombianColvilleCosta RicanCreeCreekCroatianCubanCzechCzechoslovakianDanishDelawareDominicanDutchEastern EuropeanEcuadorianEgyptianEnglishEstonianEthiopianEuropeanFijianFilipinoFinnishFrenchFrench American IndianFrench CanadianGermanGerman RussianGhanaianGreekGuamanian / ChamorroGuatemalanGuyaneseHaitianHonduranHopiHungarianIcelanderIndian (Asian)IndonesianInupiatIranianIraqiIrishIroquoisIsraeliItalianJamaicanJapaneseJordanianKenyanKoreanLaotianLatvianLebaneseLiberianLithuanianLumbeeLuxembourgerMacedonianMalaysianMalteseMarshalleseMexicanMexican American IndianMongolianMoroccanNative HawaiianNavajoNepaleseNew ZealanderNicaraguanNigerianNorthern EuropeanNorwegianOkinawanOsagePaiutePakistaniPalestinianPanamanianParaguayanPennsylvania GermanPeruvianPimaPolishPortuguesePotawatomiPuebloPuerto RicanPuget Sound SalishRomanianRussianSalvadoranSamoanScandinavianScotch-IrishScottishSeminoleSenegaleseSerbianShoshoneSierra LeoneanSiouxSlavicSlovakSloveneSomaliSouth AfricanSouth AmericanSouth American IndianSoviet UnionSpaniardSpanishSpanish AmericanSpanish American IndianSri LankanSubsaharan AfricanSwedishSwissSyrianThaiTlingit-HaidaTonganTrinidadian and TobagonianTsimshianTurkishUgandanUkrainianUruguayanUteVenezuelanVietnameseWelshWest IndianYakamaYaquiYugoslavianYup'ik
Ancestry (Percentage)
AfghanAfricanAlaska NativeAlaskan AthabascanAlbanianAleutAlsatianAmericanApacheArabArgentineanArmenianAustralianAustrianBahamianBangladeshiBasqueBelgianBelizeanBhutaneseBlackfeetBolivianBrazilianBritishBritish West IndianBulgarianBurmeseCajunCambodianCanadianCelticCentral AmericanCentral American IndianCherokeeCheyenneChickasawChileanChineseChippewaChoctawColombianColvilleCosta RicanCreeCreekCroatianCubanCzechCzechoslovakianDanishDelawareDominicanDutchEastern EuropeanEcuadorianEgyptianEnglishEstonianEthiopianEuropeanFijianFilipinoFinnishFrenchFrench American IndianFrench CanadianGermanGerman RussianGhanaianGreekGuamanian / ChamorroGuatemalanGuyaneseHaitianHonduranHopiHungarianIcelanderIndian (Asian)IndonesianInupiatIranianIraqiIrishIroquoisIsraeliItalianJamaicanJapaneseJordanianKenyanKoreanLaotianLatvianLebaneseLiberianLithuanianLumbeeLuxembourgerMacedonianMalaysianMalteseMarshalleseMexicanMexican American IndianMongolianMoroccanNative HawaiianNavajoNepaleseNew ZealanderNicaraguanNigerianNorthern EuropeanNorwegianOkinawanOsagePaiutePakistaniPalestinianPanamanianParaguayanPennsylvania GermanPeruvianPimaPolishPortuguesePotawatomiPuebloPuerto RicanPuget Sound SalishRomanianRussianSalvadoranSamoanScandinavianScotch-IrishScottishSeminoleSenegaleseSerbianShoshoneSierra LeoneanSiouxSlavicSlovakSloveneSomaliSouth AfricanSouth AmericanSouth American IndianSoviet UnionSpaniardSpanishSpanish AmericanSpanish American IndianSri LankanSubsaharan AfricanSwedishSwissSyrianThaiTlingit-HaidaTonganTrinidadian and TobagonianTsimshianTurkishUgandanUkrainianUruguayanUteVenezuelanVietnameseWelshWest IndianYakamaYaquiYugoslavianYup'ik
Immigrant Origin (Total)
AfghanistanAfricaArgentinaArmeniaAsiaAustraliaAustriaBahamasBangladeshBarbadosBelarusBelgiumBelizeBosnia and HerzegovinaBrazilBulgariaBurma / MyanmarCambodiaCameroonCanadaCaribbeanCentral AmericaChileChinaColombiaCongoCosta RicaCroatiaCubaCzechoslovakiaDenmarkDominican RepublicEastern AfricaEastern AsiaEastern EuropeEcuadorEgyptEl SalvadorEnglandEritreaEthiopiaEuropeFijiFranceGermanyGhanaGreeceGuatemalaHaitiHondurasHong KongHungaryIndiaIndonesiaIranIraqIrelandIsraelItalyJamaicaJapanJordanKazakhstanKenyaKoreaKuwaitLaosLatin AmericaLatviaLebanonLiberiaLithuaniaMalaysiaMexicoMicronesiaMiddle AfricaMoldovaMoroccoNepalNetherlandsNicaraguaNigeriaNorth MacedoniaNorthern AfricaNorthern EuropeNorwayOceaniaPakistanPanamaPeruPhilippinesPolandPortugalRomaniaRussiaSaudi ArabiaScotlandSerbiaSingaporeSomaliaSouth AfricaSouth AmericaSouth Central AsiaSouth Eastern AsiaSouthern EuropeSpainSri LankaSudanSwedenSwitzerlandSyriaTaiwanThailandTrinidad and TobagoTurkeyUgandaUkraineUruguayUzbekistanVenezuelaVietnamWestern AfricaWestern AsiaWestern EuropeYemen
Immigrant Origin (Percentage)
AfghanistanAfricaArgentinaArmeniaAsiaAustraliaAustriaBahamasBangladeshBarbadosBelarusBelgiumBelizeBosnia and HerzegovinaBrazilBulgariaBurma / MyanmarCambodiaCameroonCanadaCaribbeanCentral AmericaChileChinaColombiaCongoCosta RicaCroatiaCubaCzechoslovakiaDenmarkDominican RepublicEastern AfricaEastern AsiaEastern EuropeEcuadorEgyptEl SalvadorEnglandEritreaEthiopiaEuropeFijiFranceGermanyGhanaGreeceGuatemalaHaitiHondurasHong KongHungaryIndiaIndonesiaIranIraqIrelandIsraelItalyJamaicaJapanJordanKazakhstanKenyaKoreaKuwaitLaosLatin AmericaLatviaLebanonLiberiaLithuaniaMalaysiaMexicoMicronesiaMiddle AfricaMoldovaMoroccoNepalNetherlandsNicaraguaNigeriaNorth MacedoniaNorthern AfricaNorthern EuropeNorwayOceaniaPakistanPanamaPeruPhilippinesPolandPortugalRomaniaRussiaSaudi ArabiaScotlandSerbiaSingaporeSomaliaSouth AfricaSouth AmericaSouth Central AsiaSouth Eastern AsiaSouthern EuropeSpainSri LankaSudanSwedenSwitzerlandSyriaTaiwanThailandTrinidad and TobagoTurkeyUgandaUkraineUruguayUzbekistanVenezuelaVietnamWestern AfricaWestern AsiaWestern EuropeYemen
Income
Income (Families)
Income (Households)
Poverty
Poverty (Families)
Unemployment
Employment Occupations
Employment Industries
Employer Class
Commute Time
Commute Means
School Enrollment
Education by Degree Field
Occupancy
Finances
Physical Characteristics
Portland
Compare Zip Codes
Comparison Subject

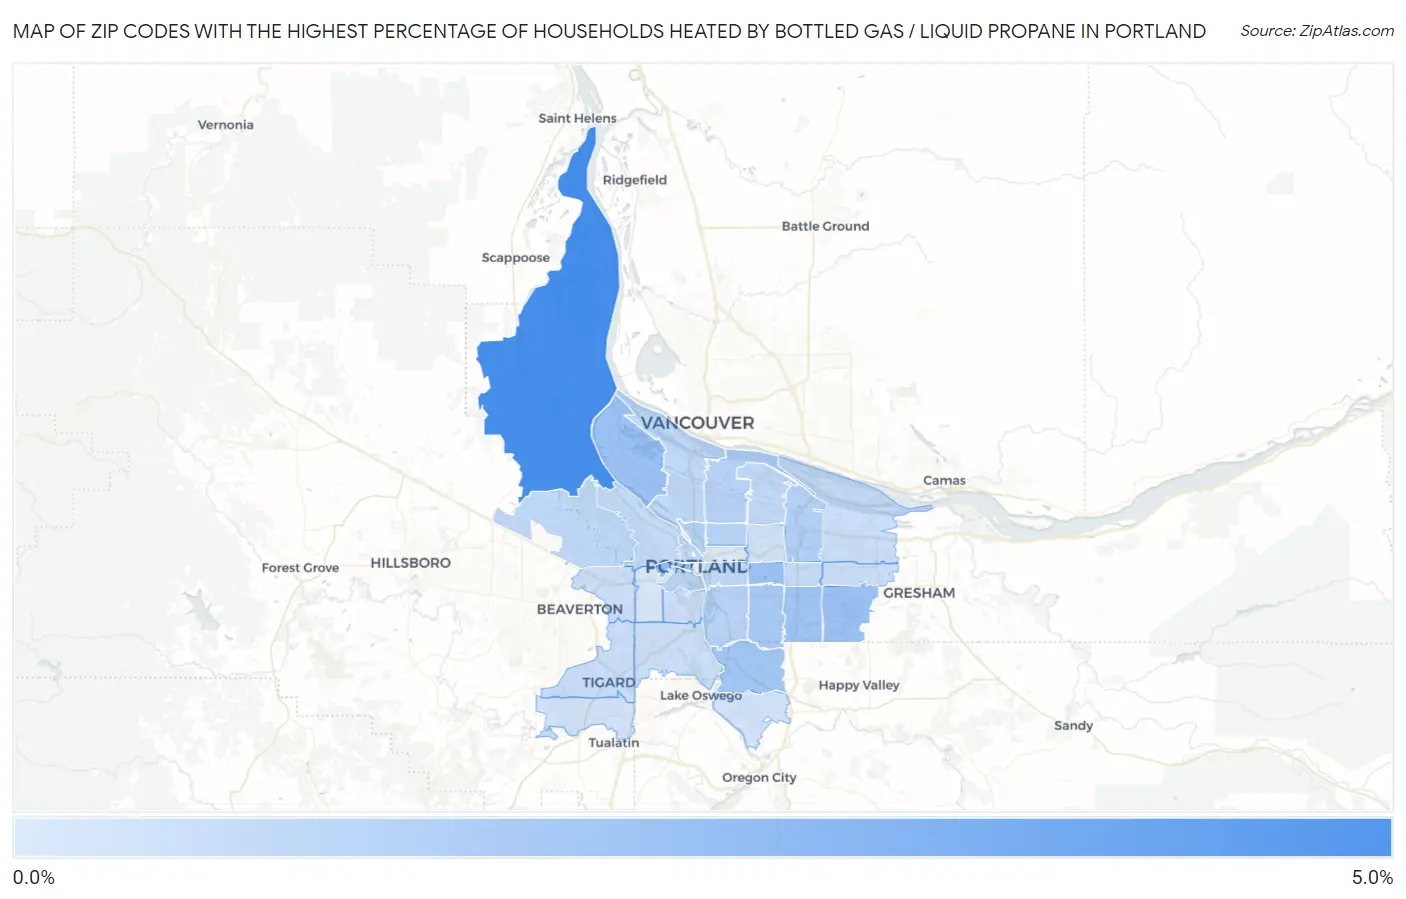
Map of Zip Codes with the Highest Percentage of Households Heated by Bottled Gas / Liquid Propane in Portland

0.0%
5.0%
Zip Codes with the Highest Percentage of Households Heated by Bottled Gas / Liquid Propane in Portland Map

Zip Codes with the Highest Percentage of Households Heated by Bottled Gas / Liquid Propane in Portland, OR

Zip Code Bottled Gas / LP Heating vs State vs National
1.972314.2%1.9%(+2.30)#1274.9%(-0.700)#19,457
2.972052.1%1.9%(+0.200)#1984.9%(-2.80)#23,015
3.972361.9%1.9%(=0.000)#2094.9%(-3.00)#23,422
4.972031.9%1.9%(=0.000)#2104.9%(-3.00)#23,445
5.972151.9%1.9%(=0.000)#2114.9%(-3.00)#23,525
6.972661.8%1.9%(-0.100)#2174.9%(-3.10)#23,710
7.972221.7%1.9%(-0.200)#2244.9%(-3.20)#23,999
8.972061.6%1.9%(-0.300)#2284.9%(-3.30)#24,288
9.972201.3%1.9%(-0.600)#2524.9%(-3.60)#25,487
10.972271.3%1.9%(-0.600)#2564.9%(-3.60)#25,656
11.972021.2%1.9%(-0.700)#2594.9%(-3.70)#25,788
12.972111.2%1.9%(-0.700)#2604.9%(-3.70)#25,831
13.972011.2%1.9%(-0.700)#2624.9%(-3.70)#25,977
14.972121.1%1.9%(-0.800)#2734.9%(-3.80)#26,269
15.972291.0%1.9%(-0.900)#2804.9%(-3.90)#26,516
16.972171.0%1.9%(-0.900)#2814.9%(-3.90)#26,619
17.972141.0%1.9%(-0.900)#2824.9%(-3.90)#26,669
18.972091.0%1.9%(-0.900)#2844.9%(-3.90)#26,759
19.972180.90%1.9%(-1.000)#2914.9%(-4.00)#27,217
20.972160.80%1.9%(-1.10)#3014.9%(-4.10)#27,590
21.972100.80%1.9%(-1.10)#3024.9%(-4.10)#27,633
22.972230.70%1.9%(-1.20)#3034.9%(-4.20)#27,766
23.972300.70%1.9%(-1.20)#3054.9%(-4.20)#27,797
24.972330.70%1.9%(-1.20)#3064.9%(-4.20)#27,818
25.972390.70%1.9%(-1.20)#3104.9%(-4.20)#27,957
26.972190.60%1.9%(-1.30)#3144.9%(-4.30)#28,155
27.972250.60%1.9%(-1.30)#3174.9%(-4.30)#28,265
28.972240.50%1.9%(-1.40)#3294.9%(-4.40)#28,529
29.972130.50%1.9%(-1.40)#3314.9%(-4.40)#28,551
30.972670.50%1.9%(-1.40)#3324.9%(-4.40)#28,557
31.972210.30%1.9%(-1.60)#3444.9%(-4.60)#29,248
32.972320.20%1.9%(-1.70)#3494.9%(-4.70)#29,440

Common Questions

What are the Top 10 Zip Codes with the Highest Percentage of Households Heated by Bottled Gas / Liquid Propane in Portland, OR?
Top 10 Zip Codes with the Highest Percentage of Households Heated by Bottled Gas / Liquid Propane in Portland, OR are:
#1
4.2%
#2
2.1%
#3
1.9%
#4
1.9%
#5
1.9%
#6
1.8%
#7
1.7%
#8
1.6%
#9
1.3%
#10
1.3%
What zip code has the Highest Percentage of Households Heated by Bottled Gas / Liquid Propane in Portland, OR?
97231 has the Highest Percentage of Households Heated by Bottled Gas / Liquid Propane in Portland, OR with 4.2%.
What is the Percentage of Households Heated by Bottled Gas / Liquid Propane in Portland, OR?
Percentage of Households Heated by Bottled Gas / Liquid Propane in Portland is 1.1%.
What is the Percentage of Households Heated by Bottled Gas / Liquid Propane in Oregon?
Percentage of Households Heated by Bottled Gas / Liquid Propane in Oregon is 1.9%.
What is the Percentage of Households Heated by Bottled Gas / Liquid Propane in the United States?
Percentage of Households Heated by Bottled Gas / Liquid Propane in the United States is 4.9%.