Zip Codes with the Highest Percentage of Population Employed in Construction & Extraction in Portland, OR

RELATED REPORTS & OPTIONS

Construction & Extraction
Population
Families and Households
Female Fertility
Female Fertility (Unmarried)
Race (Community Size)
Race (Percentage)
Ancestry (Community Size)
AfghanAfricanAlaska NativeAlaskan AthabascanAlbanianAleutAlsatianAmericanApacheArabArgentineanArmenianAustralianAustrianBahamianBangladeshiBasqueBelgianBelizeanBhutaneseBlackfeetBolivianBrazilianBritishBritish West IndianBulgarianBurmeseCajunCambodianCanadianCelticCentral AmericanCentral American IndianCherokeeCheyenneChickasawChileanChineseChippewaChoctawColombianColvilleCosta RicanCreeCreekCroatianCubanCzechCzechoslovakianDanishDelawareDominicanDutchEastern EuropeanEcuadorianEgyptianEnglishEstonianEthiopianEuropeanFijianFilipinoFinnishFrenchFrench American IndianFrench CanadianGermanGerman RussianGhanaianGreekGuamanian / ChamorroGuatemalanGuyaneseHaitianHonduranHopiHungarianIcelanderIndian (Asian)IndonesianInupiatIranianIraqiIrishIroquoisIsraeliItalianJamaicanJapaneseJordanianKenyanKoreanLaotianLatvianLebaneseLiberianLithuanianLumbeeLuxembourgerMacedonianMalaysianMalteseMarshalleseMexicanMexican American IndianMongolianMoroccanNative HawaiianNavajoNepaleseNew ZealanderNicaraguanNigerianNorthern EuropeanNorwegianOkinawanOsagePaiutePakistaniPalestinianPanamanianParaguayanPennsylvania GermanPeruvianPimaPolishPortuguesePotawatomiPuebloPuerto RicanPuget Sound SalishRomanianRussianSalvadoranSamoanScandinavianScotch-IrishScottishSeminoleSenegaleseSerbianShoshoneSierra LeoneanSiouxSlavicSlovakSloveneSomaliSouth AfricanSouth AmericanSouth American IndianSoviet UnionSpaniardSpanishSpanish AmericanSpanish American IndianSri LankanSubsaharan AfricanSwedishSwissSyrianThaiTlingit-HaidaTonganTrinidadian and TobagonianTsimshianTurkishUgandanUkrainianUruguayanUteVenezuelanVietnameseWelshWest IndianYakamaYaquiYugoslavianYup'ik
Ancestry (Percentage)
AfghanAfricanAlaska NativeAlaskan AthabascanAlbanianAleutAlsatianAmericanApacheArabArgentineanArmenianAustralianAustrianBahamianBangladeshiBasqueBelgianBelizeanBhutaneseBlackfeetBolivianBrazilianBritishBritish West IndianBulgarianBurmeseCajunCambodianCanadianCelticCentral AmericanCentral American IndianCherokeeCheyenneChickasawChileanChineseChippewaChoctawColombianColvilleCosta RicanCreeCreekCroatianCubanCzechCzechoslovakianDanishDelawareDominicanDutchEastern EuropeanEcuadorianEgyptianEnglishEstonianEthiopianEuropeanFijianFilipinoFinnishFrenchFrench American IndianFrench CanadianGermanGerman RussianGhanaianGreekGuamanian / ChamorroGuatemalanGuyaneseHaitianHonduranHopiHungarianIcelanderIndian (Asian)IndonesianInupiatIranianIraqiIrishIroquoisIsraeliItalianJamaicanJapaneseJordanianKenyanKoreanLaotianLatvianLebaneseLiberianLithuanianLumbeeLuxembourgerMacedonianMalaysianMalteseMarshalleseMexicanMexican American IndianMongolianMoroccanNative HawaiianNavajoNepaleseNew ZealanderNicaraguanNigerianNorthern EuropeanNorwegianOkinawanOsagePaiutePakistaniPalestinianPanamanianParaguayanPennsylvania GermanPeruvianPimaPolishPortuguesePotawatomiPuebloPuerto RicanPuget Sound SalishRomanianRussianSalvadoranSamoanScandinavianScotch-IrishScottishSeminoleSenegaleseSerbianShoshoneSierra LeoneanSiouxSlavicSlovakSloveneSomaliSouth AfricanSouth AmericanSouth American IndianSoviet UnionSpaniardSpanishSpanish AmericanSpanish American IndianSri LankanSubsaharan AfricanSwedishSwissSyrianThaiTlingit-HaidaTonganTrinidadian and TobagonianTsimshianTurkishUgandanUkrainianUruguayanUteVenezuelanVietnameseWelshWest IndianYakamaYaquiYugoslavianYup'ik
Immigrant Origin (Total)
AfghanistanAfricaArgentinaArmeniaAsiaAustraliaAustriaBahamasBangladeshBarbadosBelarusBelgiumBelizeBosnia and HerzegovinaBrazilBulgariaBurma / MyanmarCambodiaCameroonCanadaCaribbeanCentral AmericaChileChinaColombiaCongoCosta RicaCroatiaCubaCzechoslovakiaDenmarkDominican RepublicEastern AfricaEastern AsiaEastern EuropeEcuadorEgyptEl SalvadorEnglandEritreaEthiopiaEuropeFijiFranceGermanyGhanaGreeceGuatemalaHaitiHondurasHong KongHungaryIndiaIndonesiaIranIraqIrelandIsraelItalyJamaicaJapanJordanKazakhstanKenyaKoreaKuwaitLaosLatin AmericaLatviaLebanonLiberiaLithuaniaMalaysiaMexicoMicronesiaMiddle AfricaMoldovaMoroccoNepalNetherlandsNicaraguaNigeriaNorth MacedoniaNorthern AfricaNorthern EuropeNorwayOceaniaPakistanPanamaPeruPhilippinesPolandPortugalRomaniaRussiaSaudi ArabiaScotlandSerbiaSingaporeSomaliaSouth AfricaSouth AmericaSouth Central AsiaSouth Eastern AsiaSouthern EuropeSpainSri LankaSudanSwedenSwitzerlandSyriaTaiwanThailandTrinidad and TobagoTurkeyUgandaUkraineUruguayUzbekistanVenezuelaVietnamWestern AfricaWestern AsiaWestern EuropeYemen
Immigrant Origin (Percentage)
AfghanistanAfricaArgentinaArmeniaAsiaAustraliaAustriaBahamasBangladeshBarbadosBelarusBelgiumBelizeBosnia and HerzegovinaBrazilBulgariaBurma / MyanmarCambodiaCameroonCanadaCaribbeanCentral AmericaChileChinaColombiaCongoCosta RicaCroatiaCubaCzechoslovakiaDenmarkDominican RepublicEastern AfricaEastern AsiaEastern EuropeEcuadorEgyptEl SalvadorEnglandEritreaEthiopiaEuropeFijiFranceGermanyGhanaGreeceGuatemalaHaitiHondurasHong KongHungaryIndiaIndonesiaIranIraqIrelandIsraelItalyJamaicaJapanJordanKazakhstanKenyaKoreaKuwaitLaosLatin AmericaLatviaLebanonLiberiaLithuaniaMalaysiaMexicoMicronesiaMiddle AfricaMoldovaMoroccoNepalNetherlandsNicaraguaNigeriaNorth MacedoniaNorthern AfricaNorthern EuropeNorwayOceaniaPakistanPanamaPeruPhilippinesPolandPortugalRomaniaRussiaSaudi ArabiaScotlandSerbiaSingaporeSomaliaSouth AfricaSouth AmericaSouth Central AsiaSouth Eastern AsiaSouthern EuropeSpainSri LankaSudanSwedenSwitzerlandSyriaTaiwanThailandTrinidad and TobagoTurkeyUgandaUkraineUruguayUzbekistanVenezuelaVietnamWestern AfricaWestern AsiaWestern EuropeYemen
Income
Income (Families)
Income (Households)
Poverty
Poverty (Families)
Unemployment
Employment Occupations
Employment Industries
Employer Class
Commute Time
Commute Means
School Enrollment
Education by Degree Field
Occupancy
Finances
Physical Characteristics
Portland
Compare Zip Codes
Comparison Subject

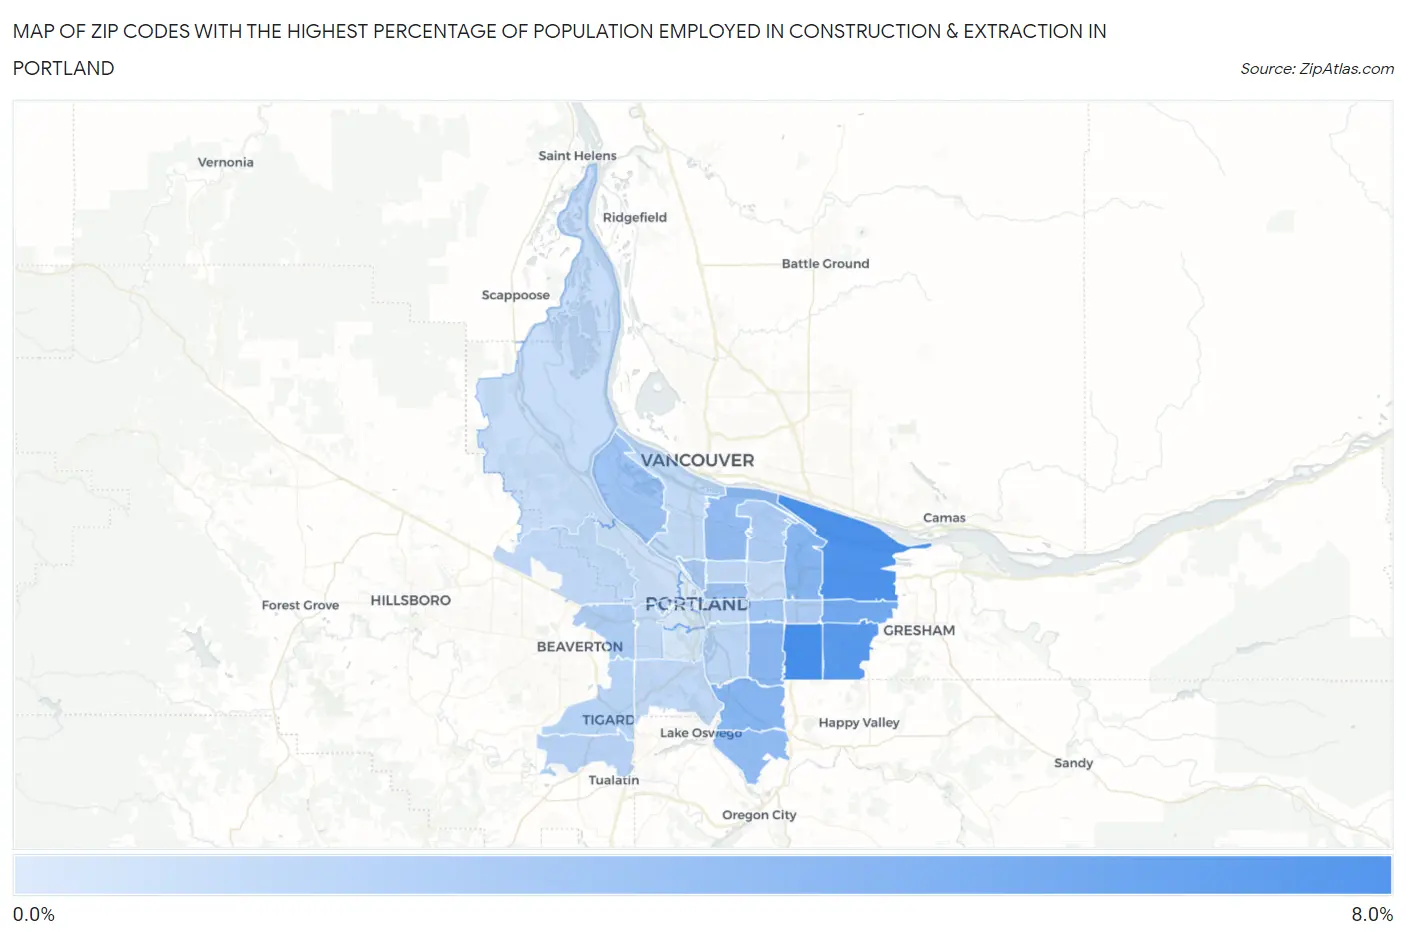
Map of Zip Codes with the Highest Percentage of Population Employed in Construction & Extraction in Portland

0.0%
8.0%
Zip Codes with the Highest Percentage of Population Employed in Construction & Extraction in Portland Map

Zip Codes with the Highest Percentage of Population Employed in Construction & Extraction in Portland, OR

Zip Code % Employed vs State vs National
1.972666.9%4.6%(+2.24)#1225.0%(+1.86)#11,079
2.972306.5%4.6%(+1.89)#1345.0%(+1.51)#12,024
3.972366.2%4.6%(+1.55)#1505.0%(+1.17)#13,022
4.972335.0%4.6%(+0.360)#2015.0%(-0.020)#16,857
5.972204.1%4.6%(-0.506)#2425.0%(-0.886)#19,907
6.972224.1%4.6%(-0.520)#2455.0%(-0.901)#19,970
7.972063.9%4.6%(-0.666)#2515.0%(-1.05)#20,529
8.972673.7%4.6%(-0.915)#2635.0%(-1.29)#21,358
9.972113.6%4.6%(-1.000)#2665.0%(-1.38)#21,634
10.972323.3%4.6%(-1.27)#2805.0%(-1.65)#22,509
11.972033.1%4.6%(-1.54)#2945.0%(-1.92)#23,357
12.972153.0%4.6%(-1.66)#2975.0%(-2.04)#23,711
13.972272.7%4.6%(-1.87)#3015.0%(-2.25)#24,368
14.972162.5%4.6%(-2.09)#3115.0%(-2.47)#24,980
15.972182.4%4.6%(-2.19)#3135.0%(-2.57)#25,235
16.972252.4%4.6%(-2.25)#3155.0%(-2.63)#25,390
17.972052.1%4.6%(-2.53)#3235.0%(-2.91)#26,106
18.972242.0%4.6%(-2.57)#3245.0%(-2.95)#26,225
19.972232.0%4.6%(-2.63)#3265.0%(-3.01)#26,366
20.972021.8%4.6%(-2.80)#3295.0%(-3.18)#26,748
21.972121.7%4.6%(-2.93)#3365.0%(-3.31)#27,032
22.972291.7%4.6%(-2.94)#3385.0%(-3.32)#27,053
23.972191.7%4.6%(-2.96)#3395.0%(-3.34)#27,085
24.972211.6%4.6%(-3.01)#3415.0%(-3.39)#27,195
25.972141.6%4.6%(-3.02)#3425.0%(-3.40)#27,225
26.972171.6%4.6%(-3.06)#3445.0%(-3.44)#27,315
27.972311.4%4.6%(-3.24)#3495.0%(-3.62)#27,676
28.972131.3%4.6%(-3.27)#3505.0%(-3.65)#27,738
29.972101.2%4.6%(-3.39)#3565.0%(-3.77)#27,948
30.972390.83%4.6%(-3.78)#3605.0%(-4.16)#28,560
31.972010.77%4.6%(-3.85)#3615.0%(-4.23)#28,640
32.972090.52%4.6%(-4.10)#3635.0%(-4.48)#28,902

Common Questions

What are the Top 10 Zip Codes with the Highest Percentage of Population Employed in Construction & Extraction in Portland, OR?
Top 10 Zip Codes with the Highest Percentage of Population Employed in Construction & Extraction in Portland, OR are:
#1
6.9%
#2
6.5%
#3
6.2%
#4
5.0%
#5
4.1%
#6
4.1%
#7
3.9%
#8
3.7%
#9
3.6%
#10
3.3%
What zip code has the Highest Percentage of Population Employed in Construction & Extraction in Portland, OR?
97266 has the Highest Percentage of Population Employed in Construction & Extraction in Portland, OR with 6.9%.
What is the Percentage of Population Employed in Construction & Extraction in Portland, OR?
Percentage of Population Employed in Construction & Extraction in Portland is 2.9%.
What is the Percentage of Population Employed in Construction & Extraction in Oregon?
Percentage of Population Employed in Construction & Extraction in Oregon is 4.6%.
What is the Percentage of Population Employed in Construction & Extraction in the United States?
Percentage of Population Employed in Construction & Extraction in the United States is 5.0%.